Looking at Google Analytics is a lot like managing your finances: something you know you should do but never get around to do it.
All you need is to do block some time to sit down and look at it in more detail.
But there are a couple of reasons why this never seems to happen.
First of all it’s not urgent. If you don’t respond to that supplier email, your products are not getting shipped. If you don’t pay your taxes in time, you’ll have to pay a fine.
That’s why Google Analytics sits more in the would-be-nice-to-have-time-for category for a lot of ecommerce entrepreneurs.
The second reason is that is looks pretty complex. You just know that when you finally do sit down to learn it, it will be hard. That’s why it’s easier to stick with what you know and like to do.
To me this is like calling on the phone. I don’t like it so I’ll do the craziest things to avoid it. Last week for example I spent half a day learning about how to code just to avoid making a call I didn’t want to make. When I finally made the call, I took me 20 minutes and I actually enjoyed the conversation.
So when I hear other store owners say things like “I think I got a Google Analytics account, but I’m not sure what to do with it.” or “Google Analytics goes way over my head.” “I know I should do something with it, but I don’t know where to start”, I totally get it.
This Google Analytics guide was made for those of you.
How to use Google Analytics for Ecommerce
If you’ve ever logged into your Google Analytics account you’ve probably seen the hundreds of reports explaining in detail what happened on your website: how many people visited, where they were coming from, if they were using a smartphone to view your store, how old they are and what color shirt they were wearing.
I made that last one up but suffice to say that there is A LOT of information in there. So I can understand why store owners find it overwhelming.
Most of us aren’t trained business analysts that sift through data all day long to find valuable insights.

The big difference between analysts and us mere mortals is that they know what they are looking for. Before they open their web analytics software of choice, they have taken the time to think about what they want to know.
If you go in without a question or just click around and look at some pretty graphs, you’re not going to get a lot of value from it. After a while you’ll get bored of it and Google Analytics will slip back to the bottom of your to-do list.
When you’re learning Google Analytics you’re really trying to do 2 things at the same time: become a web analyst and learn the Google Analytics software.
Both of those subjects are pretty complex so it’s no surprise that you can’t figure it all out in one sitting.
I’ve titled this article the Minimalist Guide, not because it’s short but because I want to give you the exact things you need right here right now. I’m not trying to turn you into a Google Analytics expect.
I also don’t want to throw a bunch of reports at you that you will only really need a year from now.
Stages of your business
The questions you have depend for a large part on the stage your business is in. If you’re only making 1 sale per month there is no point in trying to figure out the lifetime value of a customer.
The same is true for Google Analytics. At first you’ll only look at some basic high-level reports. But as your business scales, you’ll to dig deeper into your ecommerce data to answer questions that can improve your marketing and your store.
Requirements: Google Analytics
You need to have the Google Analytics tracking code installed on your store. If you don’t have a Google Analytics account, this tutorial will guide you through the necessary steps.
Installing Google Analytics code will depend on the e-commerce platform you are using:
If you’re on a different platform, do a Google search to figure out how to get it up and running. Using Google Analytics for ecommerce isn’t much different than using it for other businesses. But as we get more advanced you’ll see that there are specific ecommerce reports that are super useful!
Next I want you to click on the stage that best resembles your business today:
- Pre-launch: you’re validating your store or preparing for launch
- Launch: you’ve got traffic but no sales
- Growth: 1-10 sales per week
- Consistent growth: 10 sales per week and beyond
1. Pre-launch stage
When you’re preparing for launch, most of your work is going on behind the scenes: validating your store, getting your website design right, finding the right suppliers, working on your brand, etc.
But during all this you also should try to build excitement for what you are about to launch.
You could do this by connecting with other people, participating in relevant communities. When people are interested, or when you get the opportunity to share your link, you could send them to a coming soon page on your website that is able to collect email addresses.
Questions Google Analytics can help you answer at this stage:
Google Analytics can help you gauge if there is any interest for your products or store. People vote with their attention: a click to your website.
- How many people visited your site?
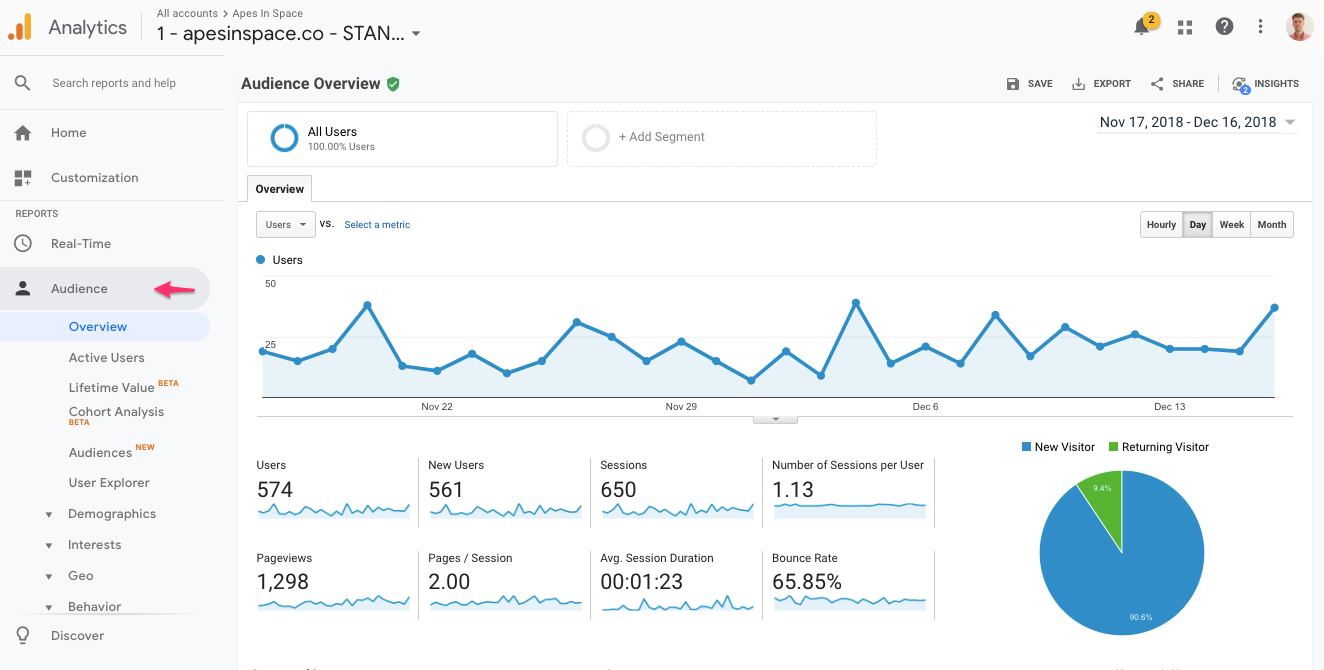
This means that you have to put effort in spreading the word about your (soon to be) store. If you’re not talking to people that would be good customers, finding places where potential customers hang out, these graphs will be pretty flat.
But if you are putting the word out there, you’ll see the number of unique visitors indicated as Users in the report above.
How to tell if you’re doing well? Compare the amount of work you’re putting in with the visitors you’re getting from it. There might not be anything to buy on your website, but the visitors usually doesn’t know this before clicking on the link. By clicking, it shows some form of interest for your store or products.
How to find this report: It’s the default screen in Google Analytics Audience > Overview.
2. Who are these visitors?
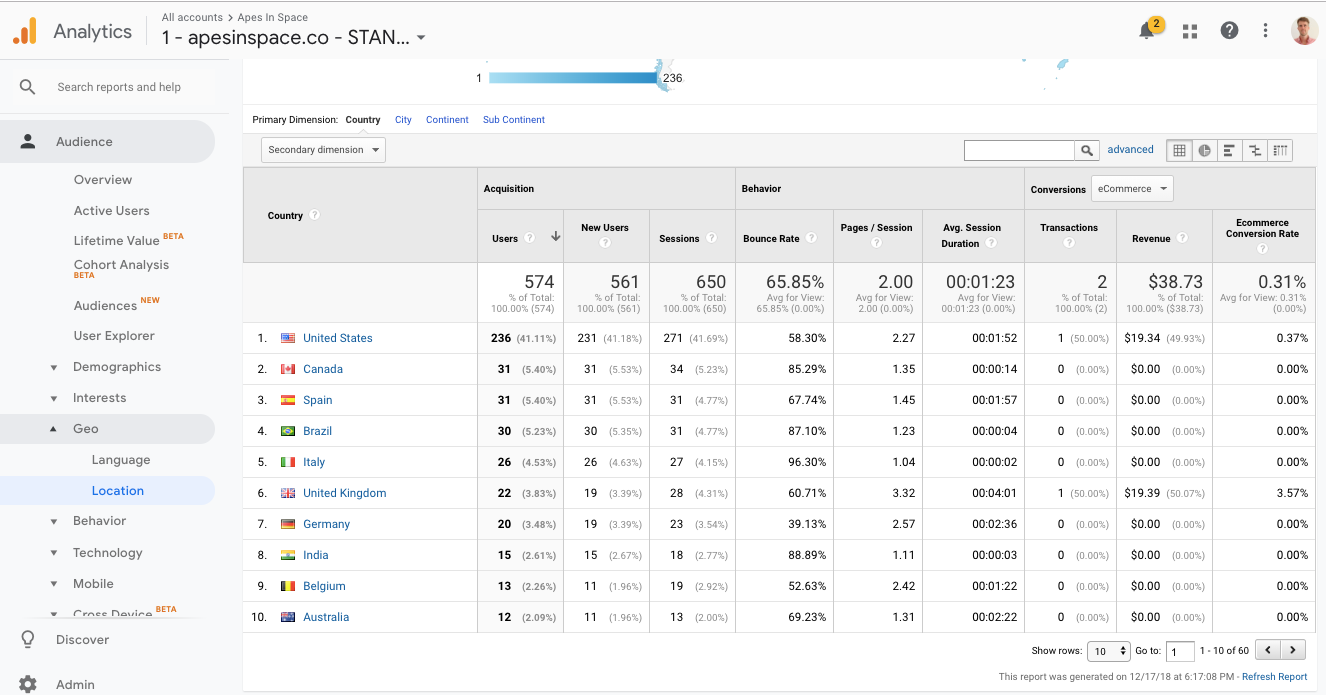
This report shows most visitors are coming from the United States.
That seems good, but if you were planning on launching a store targeting Australian, the report above would tell you that you’re not really focusing your early efforts in the right places.
Maybe you need to target different websites or communities that gets more visitors from Australia. This is also a learning that could also influence where you’ll focus your marketing efforts when that time comes.
How to find this report: Audience > Geo > Location
3. How did they get on your website?
This report will tell you how those people found your website. A couple of pointers:
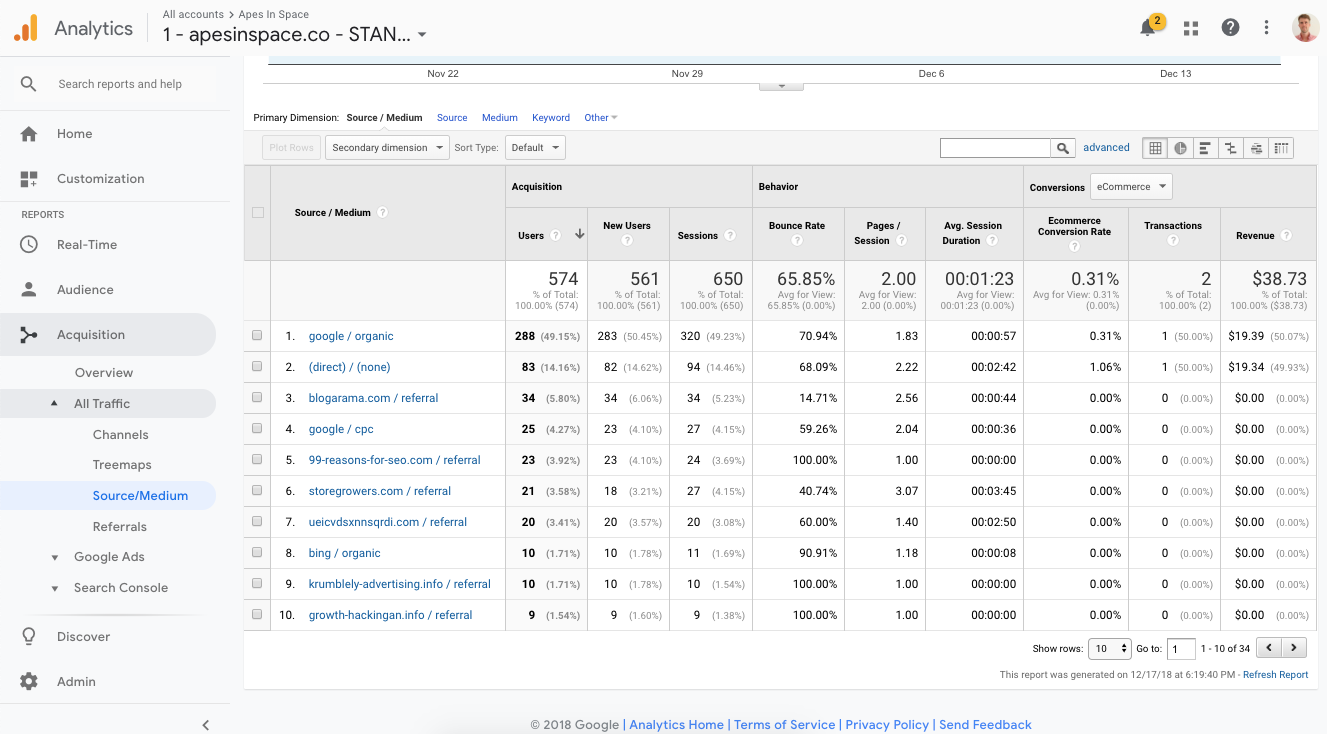
- google / organic: visitors that clicked through to your website after searching in Google
- otherwebsite.com / referral: visitors that clicked on a link on otherwebsite.com to get to your site (The report below Referrals allows you to see which page that other website linked to you)
- google /cpc: visitors that came from Google Ads
- direct / (none): these are all the visitors where Google Analytics doesn’t have a clue where they come from. These could be people that typed in your URL directly in their browser address bar. Or it could be that the information where they were coming from somehow got lost. This happens a lot visitors that click through on links in emails. (for a trick on how to fix this, look at the UTM parameters in the Growth stage)
This report can already give you some ideas on which websites can drive traffic. Again compare your efforts versus the results you’re getting.
How to find this report: Acquisition > All Traffic > Source/Medium
4. How many visitors have left their email addresses?
While visiting a website shows some level of interest, it’s a pretty small commitment. The next step is for a visitor to leave his email address.
So if you attract the right people to your website and manage to convince them that you’ll soon have some great to offer, it give you extra validation. And not to mention it builds a list of qualified people you can notify as soon as you launch.
Keeping track of visitors that sign up for your email list sounds trivial. But trust me that’s it’s more work than it’s worth at this stage.
There are loads of different solutions for coming soon pages: different platform, different email software, etc. Each of them has a different way to track newsletter sign ups.
So we’re going to go with the light version: check in the tool you’re collecting email with how many you got.
There are hundreds of other reports you could look at, but I believe these reports are the most essential before you launch.
2. Launch stage
In the days and weeks (and possibly even months) after you’ve launched, all you see is visitors. And while visitors stats can be intoxicating at first, you quickly realize that you want buyers, not just visitors.
Questions Google Analytics can help you answer at this stage:
You’ll want to know most of the same things as during pre-launch: numbers of visitors, where they came from, etc.
But because now you’ve got your store online, there are more things visitors can look at.
- Am I getting the right visitors to my site?
If no one is buying, it’s hard to know what’s wrong: are you getting the wrong people to your site or do you have the right visitors but wrong products?
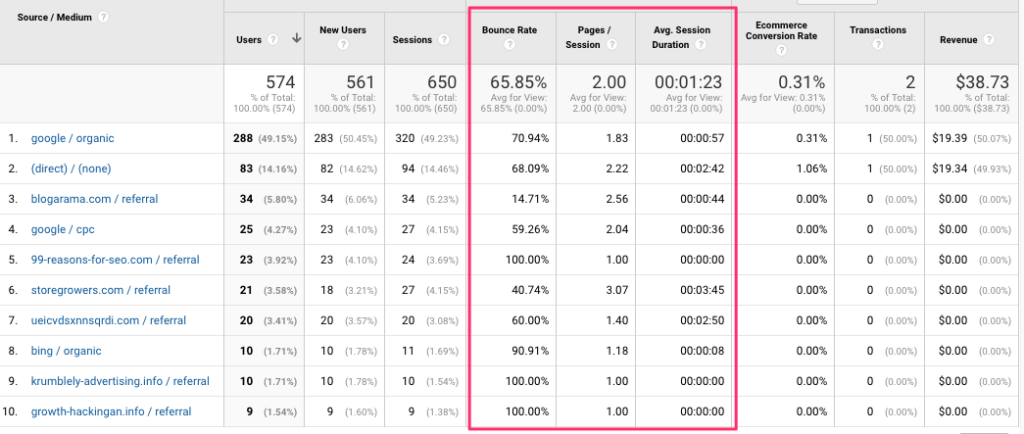
So instead of relying only on sales, the following three metrics can be indicators for the quality of your visitors:
- Pages/Session: how many pages did a visitor look at during his visit?
- Average Session duration: how long did the whole visit take?
- Bounce rate: how many people are leaving your website after only looking at a single page? (for blogs this will be high – 60-80% – and lower – 25-40% – for the rest of your site)
The best way to look at these 3 metrics is to compare them with other channels: do visitors from Facebook stay longer on your site compared visitors from Google Ads?
How to find this report: Acquisition > All Traffic > Source/Medium
2. Which are your top landing pages?
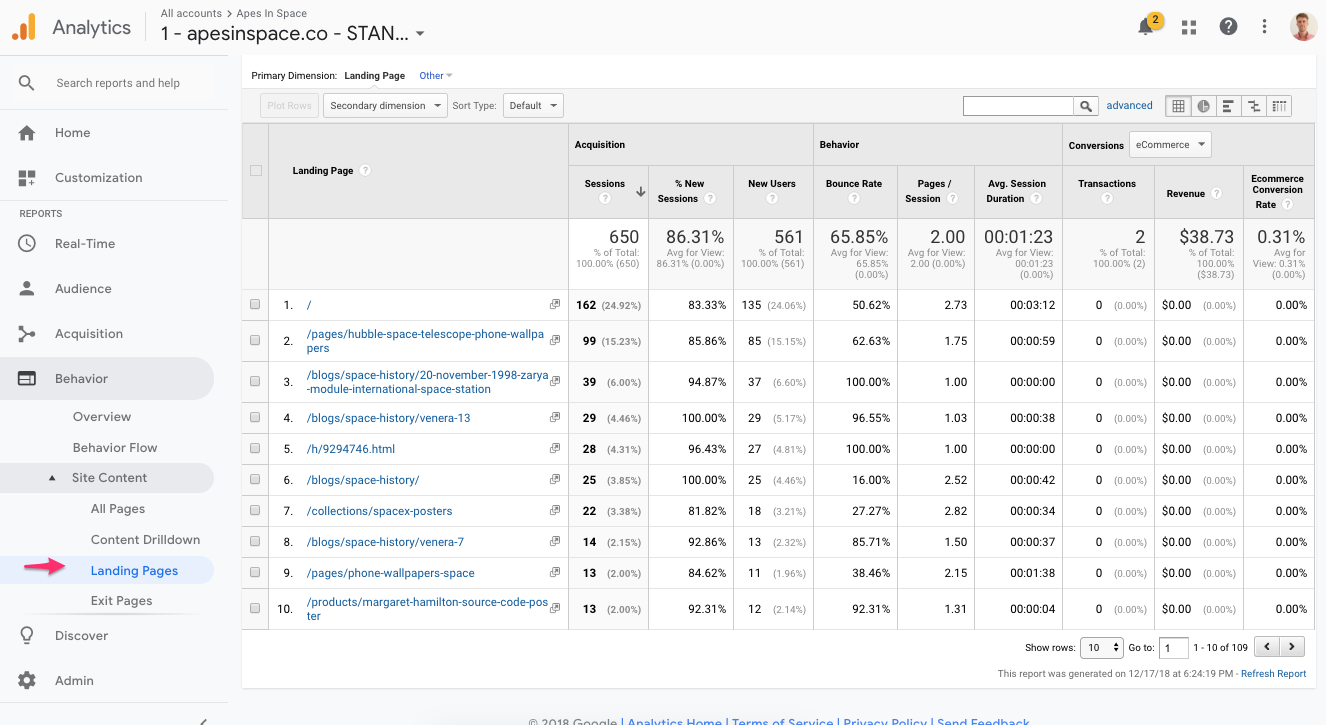
When people are building a website they often imagine the following happening:
A visitor lands on the homepage, she sees the champion product in the carousel, she clicks through to the product page, soaks up all the details, decides to add it to cart and purchases.
The reality is a lot messier. People will get to your store via all kinds of pages. So if you’re running a big promotion and you only mention it on your homepage, a lot of visitors might not see it.
Every page can be a landing page.
So knowing on which pages people enter your site and making sure your content is adapted to it can really improve the visitor experience.
How to find this report: Behaviour > Site Content > Landing Pages
3. Are visitors looking at product pages?
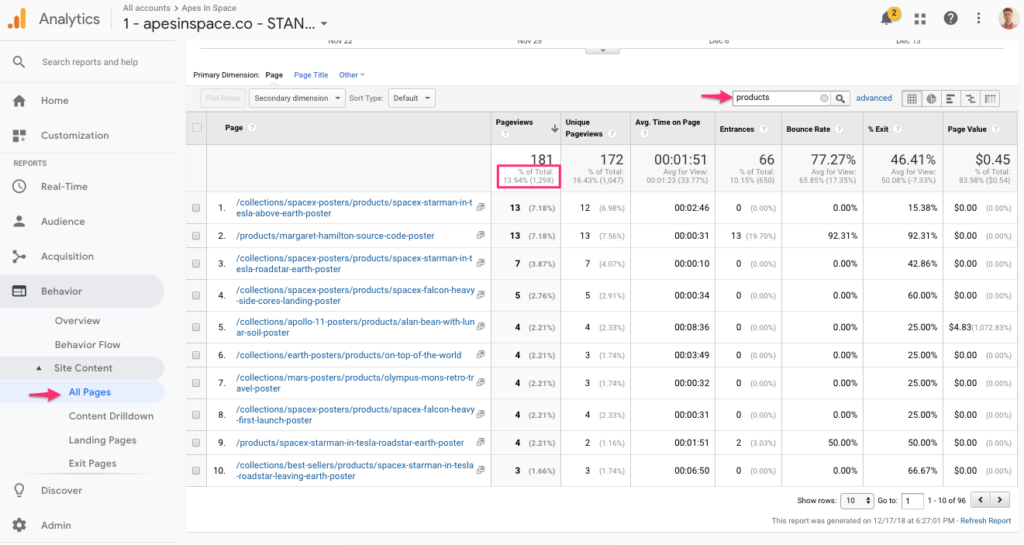
A visitor that hasn’t seen a product page can’t buy from you. So you want to make sure that the flow of your website is logical so visitors find their way to your products pages.
Depending on your e-commerce platform, the URLs will look different. The store in the example above is on Shopify and it makes it easy to distinguish between /collections/ which are the category pages and /products/ which are the actual products.
For this store, only 18% of all visitors saw an actual product page. If I wanted to increase that, I can figure out how to bring more people to those pages.
If you’ve added a new product recently but it’s not getting any visitors to its product page, maybe you need to feature it more prominently on your homepage, or promote the link more heavily.
How to find this report: Behaviour > Site Content > All Pages
4. Where are visitors leaving your website?
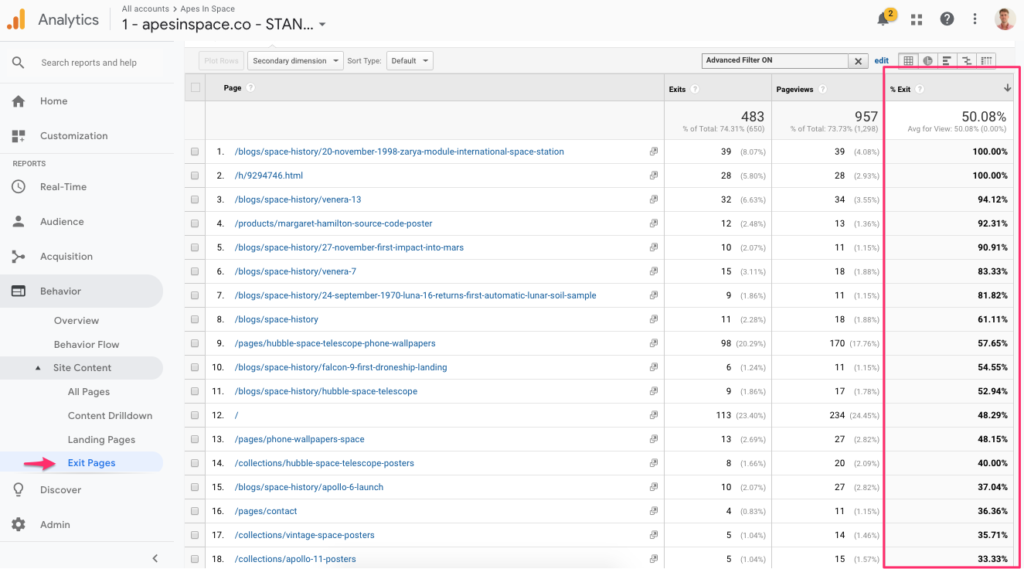
After you know how people get onto your website and what they do there, it’s time to find out where they are leaving your site.
Especially if you’re getting frustrated why none of those visitors are buying, this is an important report.
There could be a number of reasons why someone leaves your site. Maybe they didn’t find the product they were looking for, maybe your site is hard to navigate so they bailed, maybe your prices are too high so visitors go elsewhere to buy, etc.
In the screenshot, it becomes clear that the blog doesn’t succeed in getting visitors to the actual store. That means that if the store is investing a lot of $$, the actual impact is minimal. One potential experiment could be to make the call to actions bolder or to pitch more products in the actual blog articles.
This report will only tell you where things might be wrong, not why that is happening. A good way to find that out is by looking how other people browse your website.
How to find this report: Behaviour > Site Content > Exit Pages
3. Growth stage
At this stage sales are finally coming in. You’re making one to ten per sales a week but it still goes up and down a lot. Some days you’ll get a ton of visitors and a couple of sales from it, other days you can hear the crickets chirp.
The goal at this stage is to iron out the wrinkles from your website and find the marketing channels that can deliver you consistent sales.
At this stage you’re getting deeper into Google Analytics. And to get the most value from it, there is one additional piece of tracking code you need to add to your site: ecommerce tracking for Google Analytics. This will import all your sales data into Google Analytics: number of transactions, products, revenue, order value, etc.
To get ecommerce tracking working you’ll need to do 2 things:
- Enable it in Google Analytics
- Add tracking code to your online store to send the transaction data
The exact technical setup will again depend on the platform you are using:
- Shopify
- Woocommerce
- Magento
- Other platforms (gets pretty technical) or Google it 🙂
Questions Google Analytics can help you answer at this stage:
When you’re in the Growth stage, you’ll still want to know the answers that we discussed in the Pre-launch & Launch stages: number of visitors, where they come from & what pages they visit.
But with sales coming in, you can get a better view on what is REALLY working.
- Which of your marketing efforts are working?
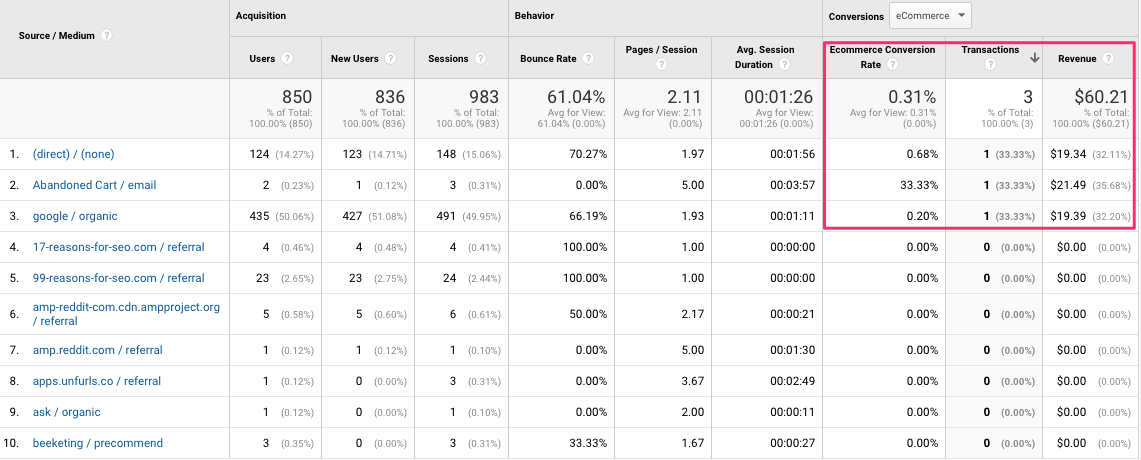
If you’re making sales you’re probably trying a bunch of different things to bring traffic to your store.
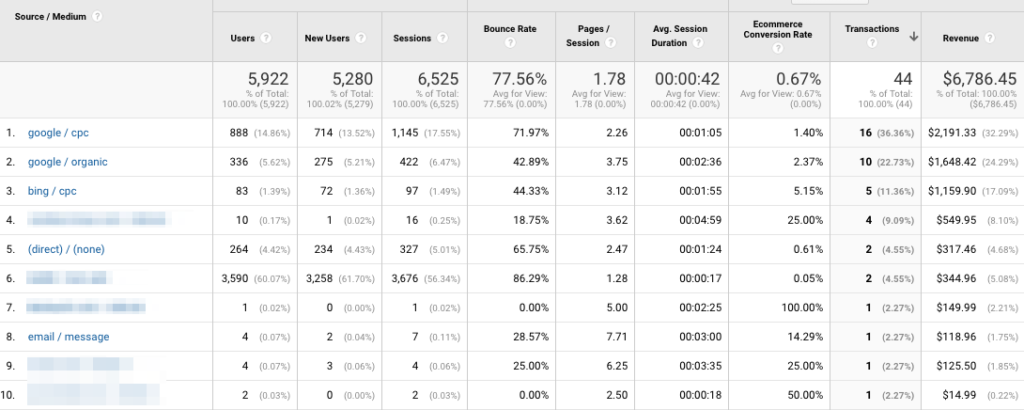
Thanks to the additional tracking code you can actually see where the traffic is coming from and how much it is worth.
The scale of the online store above is pretty small, but even seeing where those few sales came from can give you ideas on what more you can do to get sales.
How to find this report: Acquisition > All Traffic > Source/Medium (If you have Ecommerce tracking enabled you’ll see these last 3 columns)
BONUS:
For some marketing efforts, you might want more details on where your visitors come from. If you are sending potential customers email, it would be good to know which emails lead to an actual purchase.
To do that you can add UTM parameters. These are extra parameters you add to the end of your link. Use the Google URL builder, a free tool to create these links.
If you use these links in your email campaigns or advertisements, you will be able to track the results in the same report: Acquisition > Campaigns > All Campaigns
BONUS 2: If your store keeps growing and you’re running multiple marketing channels, it might be time to a look at attribution to evaluate the true impact of a specific channel.
2. How are my sales doing?
Most e-commerce platforms have a report that tells you how your business is doing: amount of sales, revenue that came in today or during the last 30 days.
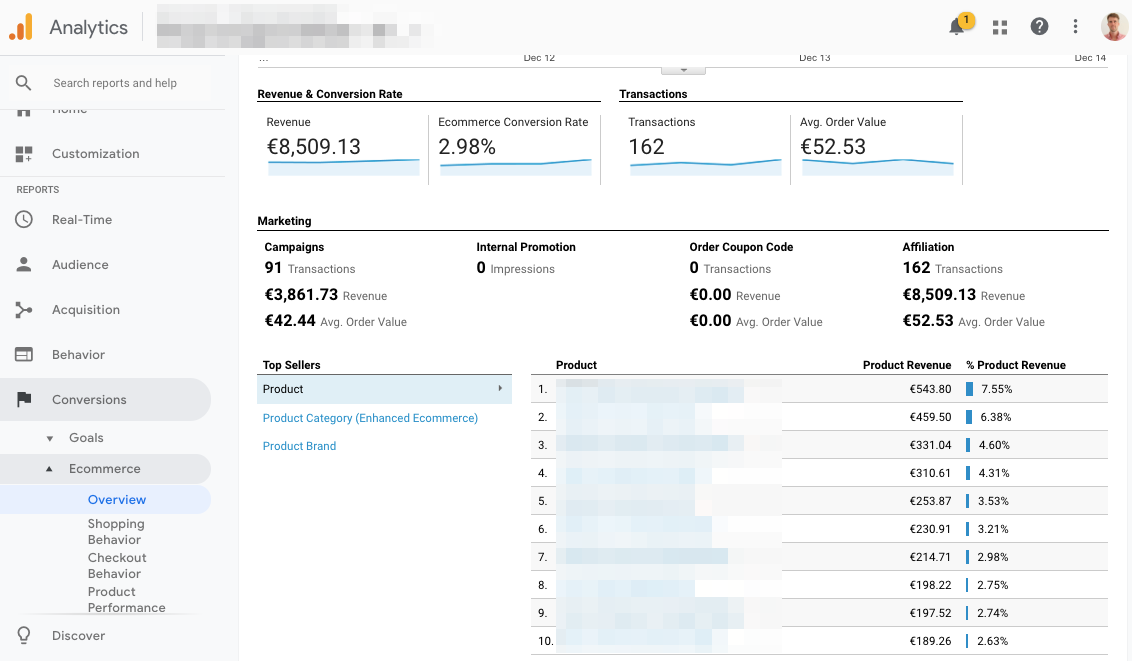
The ecommerce overview report in Google Analytics will give you a similar overview of your sales:
- The number of transactions
- Total revenue
- Your average order value
- Bestselling products
These metrics are really useful but it doesn’t really matter where you get them. What’s more important is that you look at them on a regular basis.
So instead of looking at your sales one by one as they come in, you look at the bigger picture. You’ll be able to see the progress you’re making: is the number of transactions going up, how many products are people buying on average, etc.
I enjoy finishing the week on Sunday by looking at the numbers of the past week. I evaluate my efforts versus the results and come up with some tactics to do better next week.
If once a week seems too much to you, you can also go once a month.
How to find this report: Conversions > E-commerce > Overview
4. Consistent Growth
At this stage your online store should be a well-oiled machine. Sales are coming in consistently.
Whether it’s 20 or 500 sales per week, the actual scale isn’t that important for your analytics.
The most important thing is that those consistent sales aren’t an accident. At this stage you have figured out where to find traffic and how to turn it into sales.
To grow further you are ready to do more of what works, and stop doing what didn’t work.
Questions Google Analytics can help you answer at this stage:
Again, you’ll still want to have the answers of the previous stages, the questions below are extra ones that will help you at this particular stage.
- Where are people dropping off on my website?
In the Launch phase I showed you how to find the exact pages where people leave your website. Enhanced ecommerce is an additional feature in Google Analytics that will tell you exactly what stage a visitors abandons the site.
To enable Enhanced Ecommerce on Shopify you can simply check a box in the back-end. To get this extra ecommerce data if you’re on Woocommerce or Magento is included in the e-commerce tracking setup.
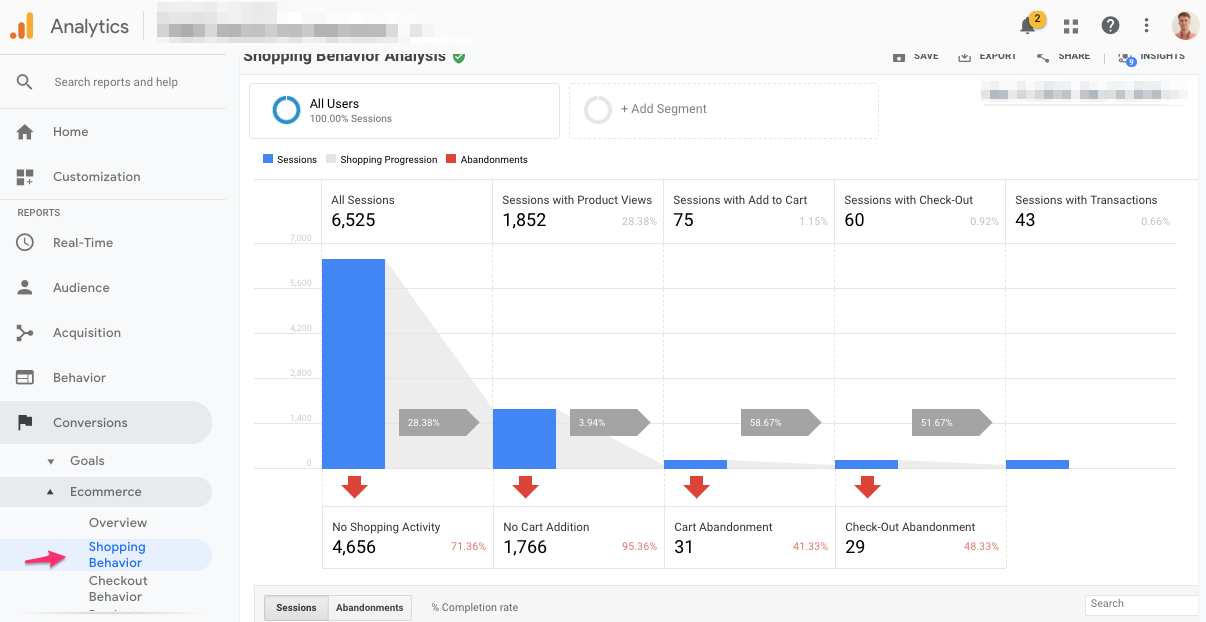
But if you get it working these ecommerce reports will show you something like this:
It shows the different stages a visitor goes through before purchasing:
- All sessions
- Sessions with product views
- Sessions with Add to Basket
- Sessions with Check-Out
- Sessions with Transactions
For the store above it is clear that most of the visitors never see a product page. If your store does have a good flow to the products pages, you can monitor the add to carts & started checkouts here as well.
How to find this report: Conversions > Shopping Analysis > Shopping Behaviour
If you have a complicated checkout, you can also find a similar report with every step of the checkout process: Conversions > Shopping Analysis > Checkout Behaviour
2. Which marketing channels bring the best customers?
If you’re running multiple marketing campaigns, now is the time to focus on what works best.
The Best one depends on a couple of variables: conversion rate, raw number of sales, order value or the associated cost.
Thanks to e-commerce tracking, Google Analytics can tell you all about sales and revenue. For cost data you’ll need to take some additional steps: linking an Google Ads account is pretty straight forward. Other advertising platforms allow you to import cost data.
But if you want to get a feel of the cost of a customer from organic search, you’ll need to crunch some numbers in a spreadsheet.
The store above mainly gets its traffic and sales from Google Ads, Bing Ads and organic. Judging by the report above, possible recommendations could be to invest more in Bing Ads as that converts better and start working harder on the SEO to get cheaper traffic.
But without the backstory of what the business is trying to do, it’s hard to draw conclusions.
Maybe they’ve been reaching out to bloggers like crazy to cover their store but it’s not working. Or maybe they’re using an SEO agency, but are paying way too much for what the current orders are actually bringing in.
How to find this report: Acquisition > All Traffic > Source/Medium
3. What products are generating the most revenue?
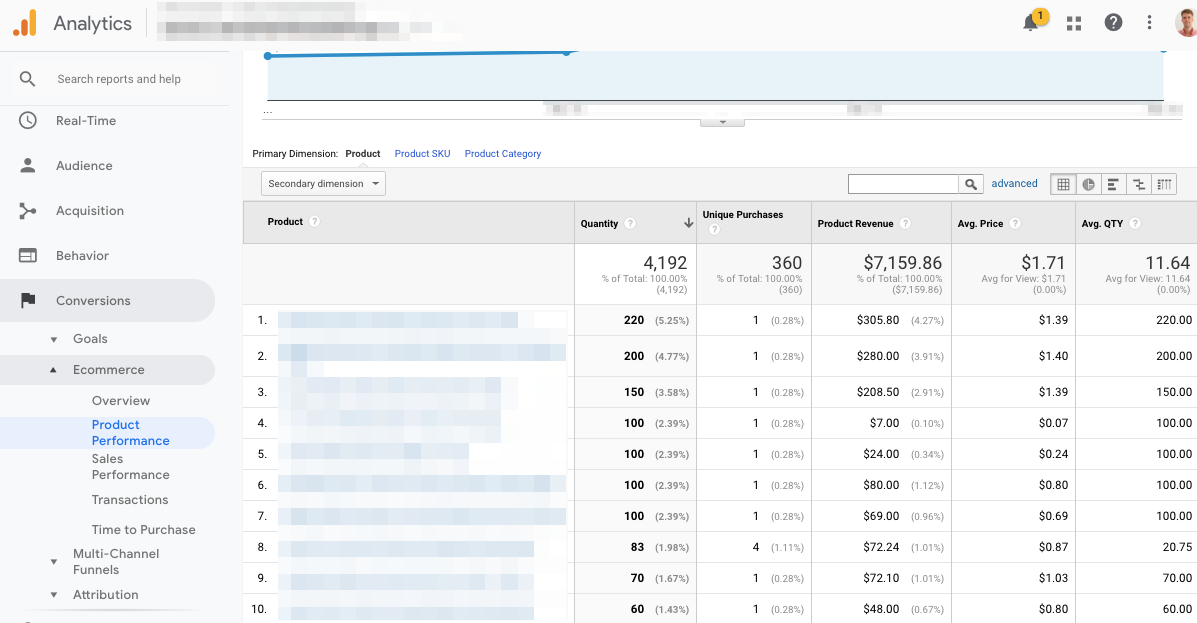
Knowing which products generate the most revenue might give you good ideas on increasing sales.
The Quantity column will tell you how many units were sold. The Unique Purchases how many customers bought 1 or more of that specific product. So if Customer #1 orders the same product 3 times and Customer #1 only orders that product 1 time, the Quantity will show 4 and Unique Purchases 2.
If you see that customers are buying multiple units of the same product, maybe it’s worth investigating that further. Can you increase the average order value by offering a volume discount? Maybe it’s something most customers don’t naturally think of, adding a suggestion to your product page could do the trick.
Product revenue will tell you in total how much revenue this specific product generated. This could inspire future product decisions: offer more of the products that are generating a lot of revenue and cut back on the ones that don’t.
How to find this report: Conversions > E-commerce > Product Performance
4. What can I do to sell more?
It’s a broad question, but selling more breaks down to:
- Getting more visitors: improve your marketing
- Getting more visitors to buy: improve your website conversion
- Getting customers to buy more: increase the average order value
As we’ve gone over the reports above, I’ve indicated a couple of ways you can use the information in Google Analytics to accomplish the first two bullets.
Now let’s take a look at the third one: how can you increase the average order value?
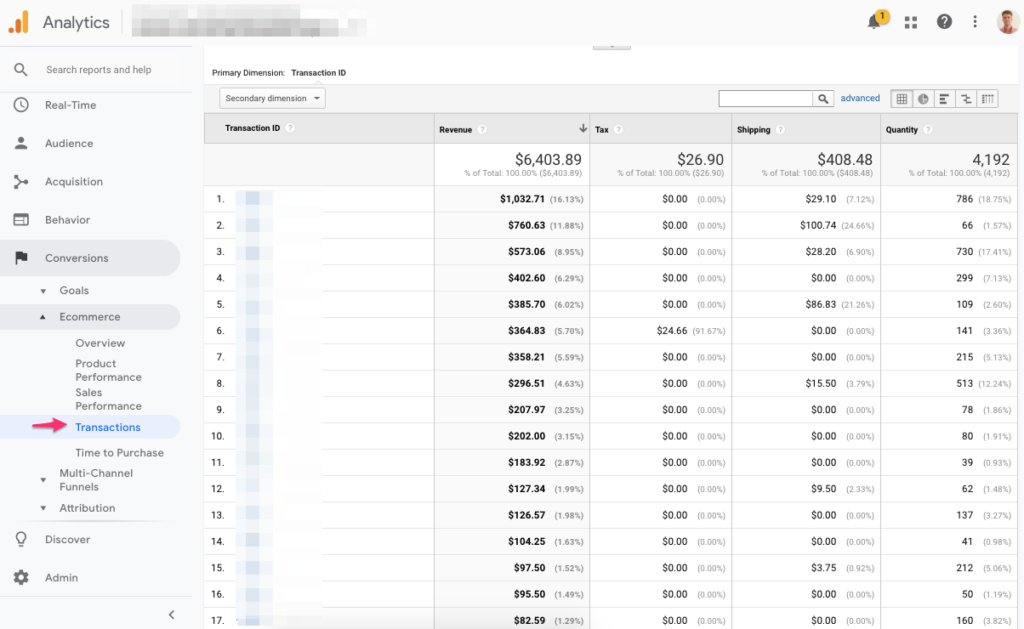
The report above shows the transaction ID, the order value. It’s immediately obvious that the order value varies significantly. The first order is over €1,000 while the others are a lot lower. If you click on the order you will actually see which products were ordered.
Comparing big versus small orders might give you some ideas for up-sell or cross-sell opportunities.
If you have a low average order value, you could try free or discounted shipping for orders above a certain level.
How to find this report: Conversions > E-commerce > Sales Performance
If you haven’t got Enhance Ecommerce enabled, you can find a similar report: Conversions > E-commerce > Transactions
Summary
Using Google analytics for ecommerce purposes can be a bit of a black box, so I hope this post was able to make it a bit more accessible for you as a store owner. And that you now know, depending on where you are in your business, how to use it and what to pay attention to.
It’s ok the only look at basic reports when you’re just starting out with your store, the other data doesn’t matter too much at that stage. And as you grow bigger as a business, you’ll get smarter and more confident how you can use the data from Google Analytics to improve your store.

This is the best article that I have ever seen for Google Analytics. This is very useful to me because now a days every seo company in jaipur demands for Google Analytics before hiring.
Thanks for your comment Codetoils!
I hope you learned something new about Google Analytics that’s useful when looking for your next job 🙂
Thank you so much for this article. I realize you plublished this article in 2018. However I received the email this last week. Last weekend I was talking to some one and they said that I needed to install Google Analytics into my store. I was very nervous about this due to the depth of it. However not as intimidated with it now due to your article. I will be refering back to it as I learn how to you Google Analytics. Thanks a million! Will be leaving updates to let you know how it’s going.
Sounds good Brien!
Not much has changed in Google Analytics since publishing, so you should have no problem following along.
Really very nice artical having useful details.. For e-commerce companies…
Hi Dennis,
Its an amazing and dedicated article. You need to track your visitors and sales that happens on your ecommerce stores perfectly to calculate your store potential traffic. ecommerce platform are in-built with these analytical reports to make their customer marketing strategy better
Thanks
Manesh
Thanks for taking the time to comment Mahesh.
You are right, most ecommerce platforms do have reporting and dashboards built-in. But they all slice and dice the data in their own way. Google Analytics is one of the only tools where I can find the reports I need, how I need them.
Thanks Dennis
This just makes my shopify store launch a bit of interesting to get at with this analyst training from you, am good to go.
Hi James,
Thanks for your comment and good luck with your launch!
Thanks Dennis
This just makes my shopify store launch a bit of interesting to get at with this analyst training from you, am good to go.
Hi James,
Thanks for your comment and good luck with your launch!
Your blog gives a lot of information regarding google analytics for eCommerce. It is very supportive and useful post. I would like to visit the post once more its valuable content. I am glad to find it. There are so many developers working on this part but this is one of the best innovative post ever. Thanks for such post.
Hey, Dennis!
Hope you’re doing fine!
Did you know if there is some difference regarding data update timing between “Acquisition -> Src/mdm” panel X “Conversions -> E-commerce -> Sales Performance” panels?
I’m facing some problems to find the updated data. In “Sales performance” I have one data shown and at “Src/mdm” panel is shown other data.
Do you have ever experienced this?
Best regards,
Victor
Hi Victor,
Just checked a couple of accounts and their reports match 100%. Both for historic time periods (last month) and very recent data (today).
2 questions: are you using Enhanced Ecommerce or regular Ecommerce?
Because the sales performance report for either is a little bit different.
– Default Ecommerce Sales Performance report: groups sales per day
– Enhanced Ecommerce Sales Performance report: lists specific orders
For which time period are you comparing numbers?
Very helpful, thanks for taking the time to lay out a basic and sequenced plan for getting a hold on a new site’s analytics.
Great article! Finally someone has clearly explained how to read the figures and not only pointed out what dimensions and metrics we see in different reports. Thanks a lot Dennis!
Happy to hear you found the article useful Lily!
whoah, this blog is excellent I love reading your articles. Keep up the great work! You know, a lot of people are hunting around for this information, you can aid them greatly.
Hi Dennis, One of my customers placed 1 order with 2 units of my product. My Google Analytics is showing 2 in the transaction. But my google ads is only showing 1 conversion for the same product. This happens all the time what can I do to capture ever unit not only every order. I have “cound value” to “every conversion” in conversions setting of google ads.
That sounds correct to me.
If you have a 1 order with 2 units, I would say that’s only a single conversion as well?
One transaction = one conversion with one or more products?
How do the conversion values compare?
You are right. Thanks Dennis.
This article guide will help in how to use Google Analytics for eCommerce companies to improve their sales and revenue by analyzing customers behavior. Thanks for sharing great article.
Exactly what I was looking for, regards for posting.
Always been a great fan of analytics and minimalism. Great post!!
Also love that combo Jagat 🙂
This is really useful! Analysing metrics is key to understanding what your business is doing well and where you can improve, but Google Analytics can be confusing when using it for the first time. Love the minimalist approach!