February marks month #6 for Apes in Space, the online store I started to sell space posters.
And finally, after 5 months of making a tiny amount progress, I scored my first win.
It turned out to be an insight from a (failed) Facebook ad campaign from a few months back that held the key to this jump in sales.
So I’m excited to share everything what happened during February 2018. As usual I’ve divided this article up into the following areas: Marketing, Financials, Merchandise, Effort & Psychology.
👉 By December 2018, I want this new store to consistently hit $1,000 / month in revenue. Sign up for new updates and follow the journey!
📈 Marketing
Stats
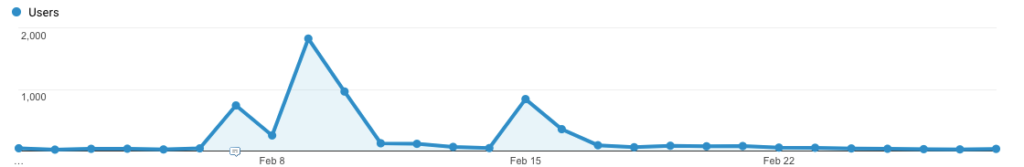
Total number of sessions: 6,623 (+1,719% compared to January)
The number of sessions almost 20x’ed. The spikes in the chart below are when I turned on the Facebook ads.
Afterwards, traffic went back to its normal levels.
Next, let’s look at the quality of these visitors: Pages/Session, Avg. Session Duration & Bounce rate.
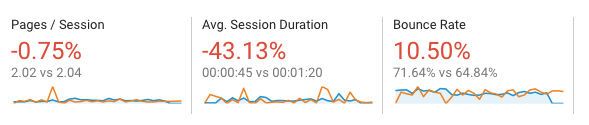
That increased amount of traffic led to a slight decrease in visitor quality. This decrease is in large part because of the visitors are from the Facebook ad campaigns.
But these averages are still within an acceptable range.
Next let’s look at where the visitors in February came from:
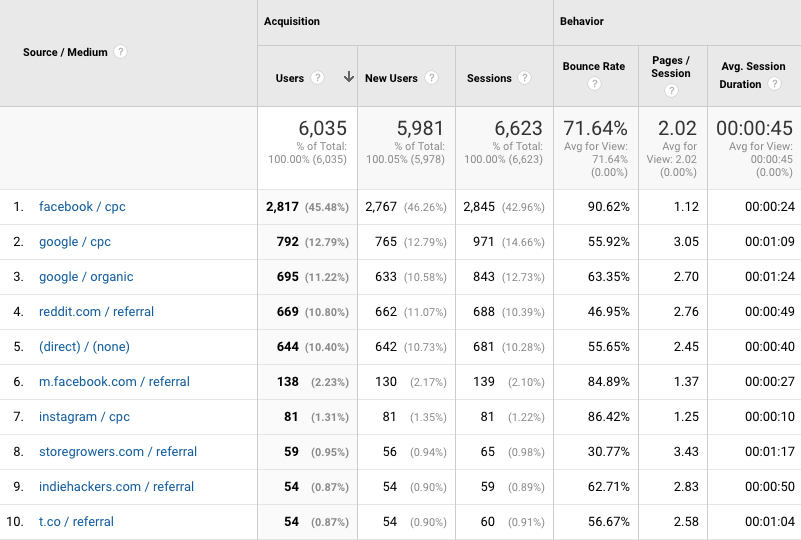
Traffic sources report in Google Analytics
Facebook ads top the February chart. Most of this traffic came onto a category or product page. So the 90% doesn’t look great.
Compare that to Google Adwords with a bounce rate of 63% and a lot higher session duration.
In the third spot we have organic traffic, which is almost 10x compared to last month: 843 sessions vs 96 in January.
There also was a good spike in referral traffic from reddit.
SEO
My core traffic strategy is:
- Ads for short term gains (improve website, create email funnel, make some sales)
- Organic search in the long term
To get that organic traffic, I’ve been creating space themed blog content. And during February, I didn’t publish much. I only got 1 article out.
But the organic traffic still increased tenfold. So where was this coming from?
This increase was almost all thanks to new product and category pages that ranked extremely well. I timed these products to go live with the very first launch of the SpaceX Falcon Heavy rocket.
This event was really hot and there were very few relevant search results, so I quickly rose to the top for searches like: “spacex starman”:
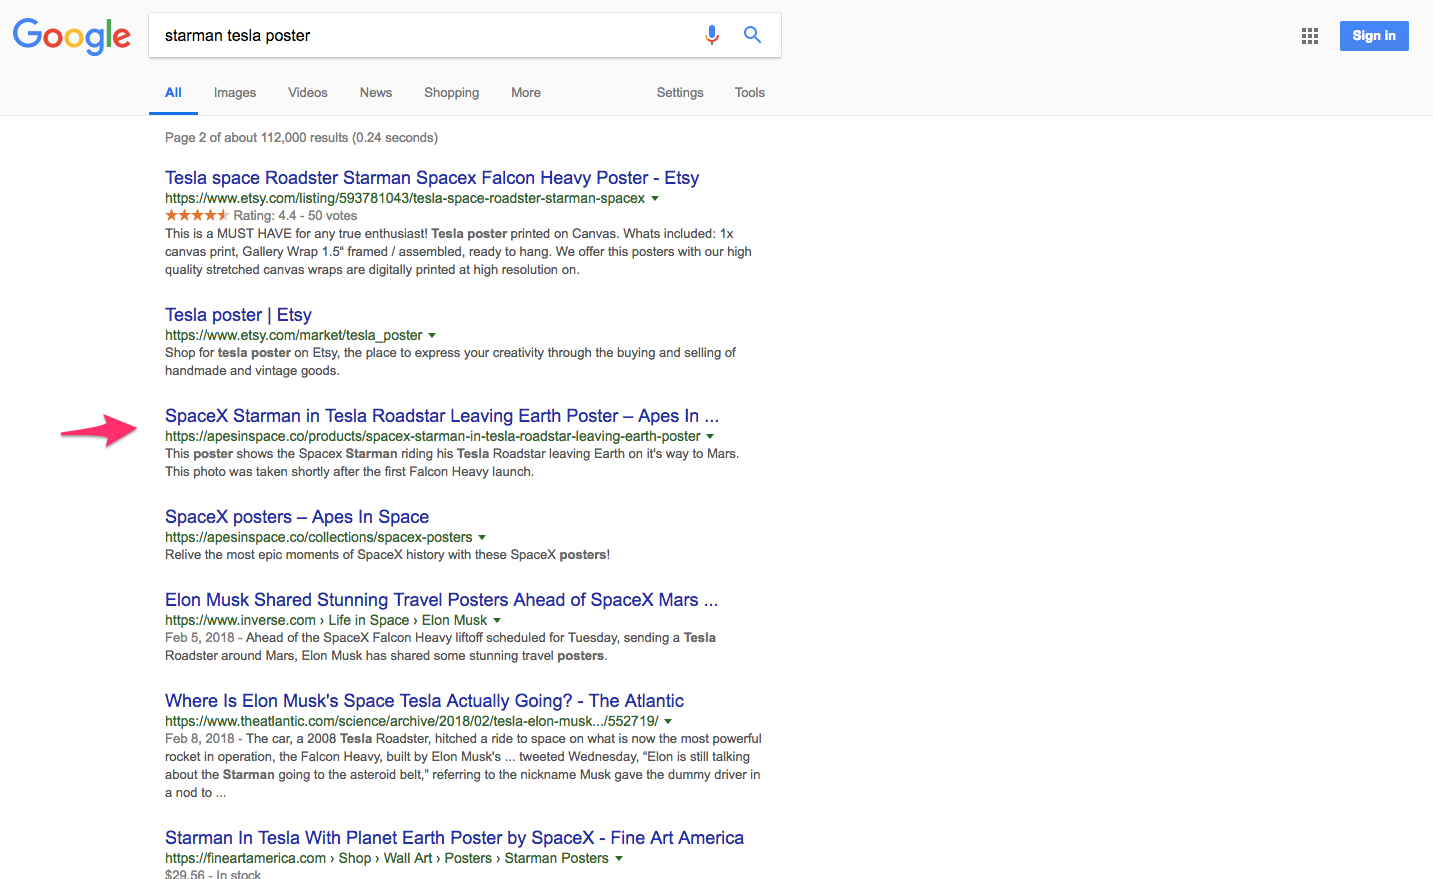
Google search results for starman tesla poster
(FYI: I just took this screenshot about a month later, so I’ve been pushed back to page 2 while other vendors have caught up.)
But the increase in visibility in the search results is very clear by looking at the Google Search Console:
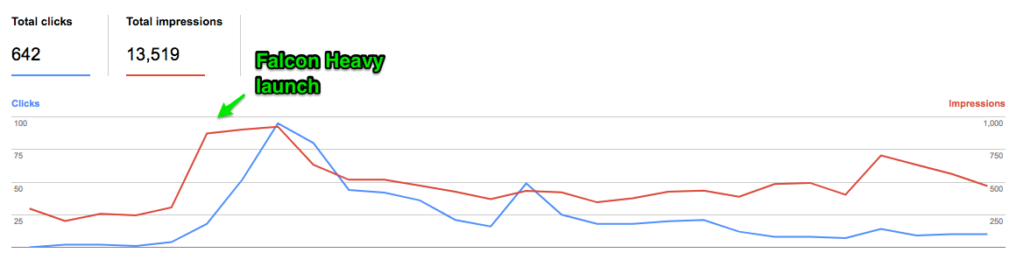
Google search console clicks and impressions graph
You can see the spike in impressions and clicks.
Traffic has died down since (consumer interest as well). Here is what the event looked like in Google Trends:
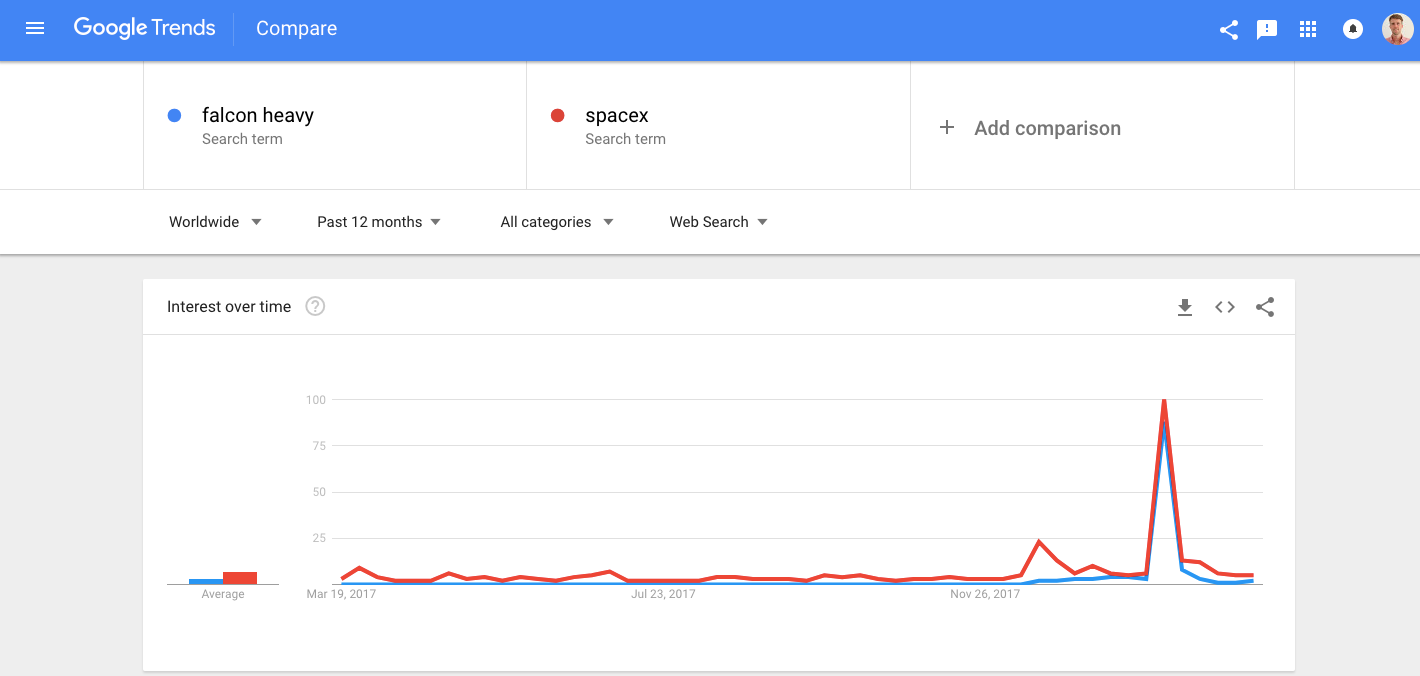
google trends for falcon heavy and spacex
But I find it very interesting how the organic traffic the site gets today is a lot higher than before. Here is a 90 day graph:
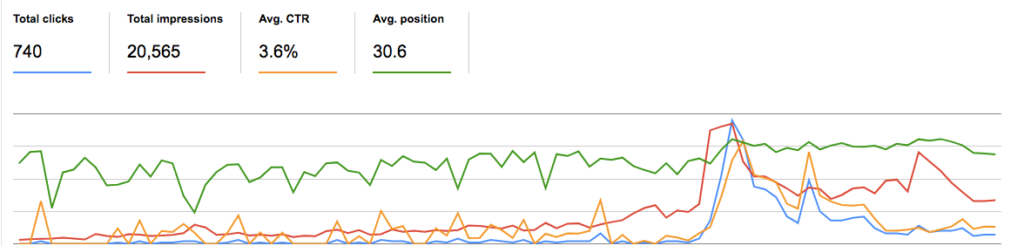
Google search console 90 day chart
There is a lot going on in the chart above, so let me tell you what sparked my interest.
It seems that right around the launch of those new products, the CTR and average position went up. Besides the promotion on the different social platforms, I don’t think I have picked up new links to the site.
Before the site was ranking between positions 30-60, but now we’ve entered the 20s.
I’m speculating here but maybe having new and relevant content available as one of the first sites made Google feature the domain pretty high up. Then when it saw the CTR was better than some of the other domains, it started ranking other pages from the apesinspace.co higher as well.
Here is the same chart for a blog post that is totally unrelated to anything SpaceX or Falcon Heavy: 29 September 1945 – German Rocket Genius Wernher von Braun Arrives In The US
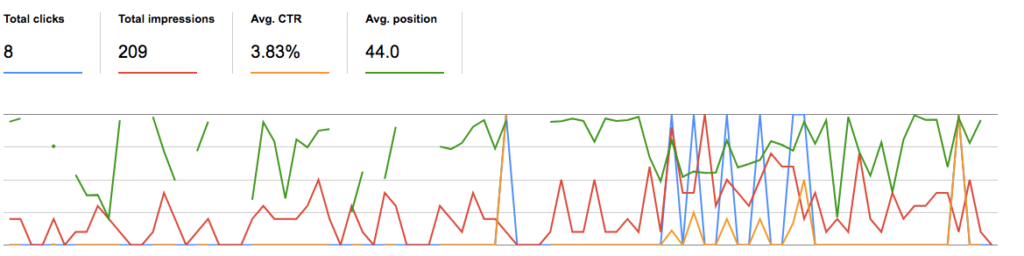
Google search console 90 day chart example
This is again a 90 day chart. You can see not much is happening until about 2/3rds in the graph. That’s right around the FH launch event. After it started ranking higher and getting more impressions.
This shows the interplay between all of the different marketing channels. A good blog post or new product page can compound with the effect of other marketing efforts.
Since I already was behind with content production in January and now also February, I’m going to put in extra effort to make March.
I’ve researched 6 posts for March so let’s see how that goes!
Email marketing
Last month, I made a tweak to the popups on the website to have one for the blog and one for people browsing product pages. With the increased traffic, those have done pretty well:
Product popup
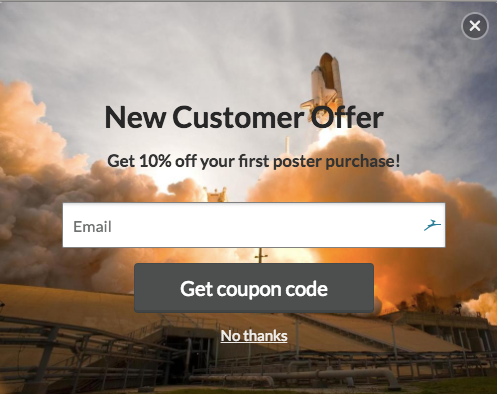
Results: 4748 views / 25 signups (0.53% conversion rate)
Blog content popup
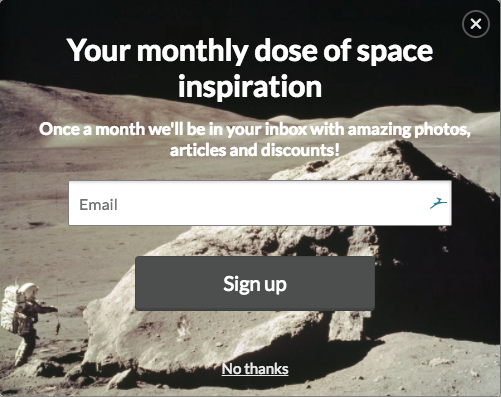
Results: 181 views / 1 sign up (0.55% conversion rate)
These aren’t amazing numbers, but 8 out of the 25 optins redeemed their coupons while purchasing. So the visitors that do leave their email have a VERY high chance of converting.
Besides these popups, the email list also grew through orders and a few other optins.
Here are the stats:
- Total email subscribers: 73 (+66 vs January!)
With a ton of traffic coming in, there were a lot of purchases, but also a lot of abandoned carts.
Klaviyo sent out about 20 abandoned cart emails, but none of those led to a sale.
Still, it feels good that this is going on in the background.
With 73 people on the email list, putting together a newsletter just became a little more valuable. I know newsletters can take a lot of time, so I need to look how I can send something worth opening that is easy to put together.
Probably I’ll pick a “Photograph of the month”, list the new products and link to the top blog posts of the month.
Besides that I want to get started on these automated flows that Klaviyo already has in place. Because they only require you to set them up once, they have a high ROI.
Google Adwords
I had set up my Google Ads campaigns at the end of January.
I knew there was search volume from the keyword research, but it’s always a guess how well all that traffic will translate into sales.
Here is the breakdown of the campaigns:
- Clicks: 1,006
- Cost per click: $0.57
- Cost: $578.21
- Orders: 13
- Conversion rate: 1.3%
- Revenue: $346.67
- AOV: $26.67
- ROAS: 0.6
That’s a lot of traffic! But it wasn’t profitable, for every $1 I put in, I only made $0.6 back. To be profitable, I need to make about $1 for every $0.6 invested.
But you don’t really know that unless you try :p
When I saw the amount of organic searches increase, I knew that I was capturing only a small piece of all those searches. So I wanted to increase my budget for those specific keywords:
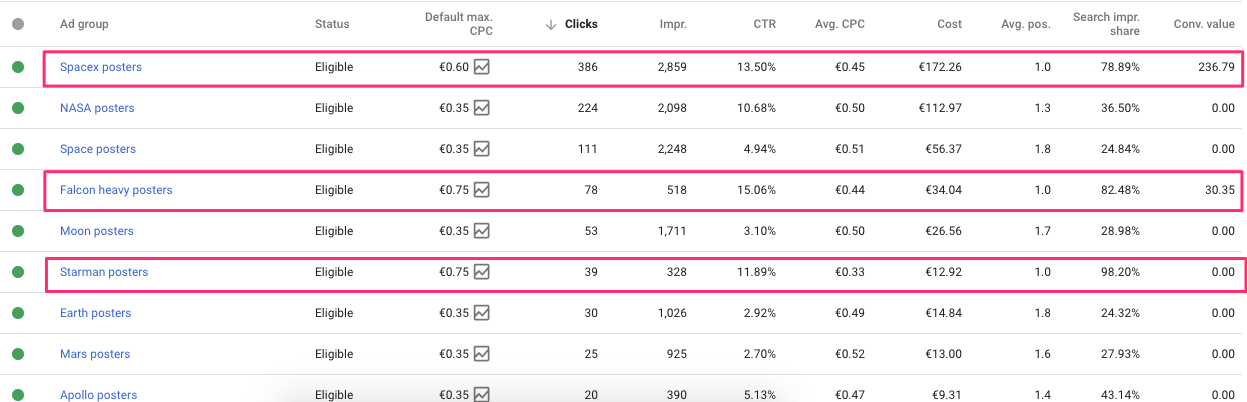
Most popular ad groups in Google Adwords
You can see high percentages in the Search Impression share column. That means my ads were showing for 80-100% of all searches for these specific keywords. Compare that to other ad groups like “space posters” which is currently only at 25%.
This got me a lot of extra clicks, but not a lot of extra sales.
My plan for March is aiming for a lot lower CPCs and spend a lot less overall. I’ll also experiment with Google Shopping ads to see how they perform.
I haven’t picked up any sales from ad groups like moon posters or space posters, so my guess is that I’ll have to be really tight on the budget.
Facebook Ads
In the Falcon Heavy post-launch post I showed that I had 2 campaigns running on Facebook: one that promoted a post with a video from the launch, and one retargeting campaign to translate that traffic into sales.
Here is what that Facebook ad looked like:
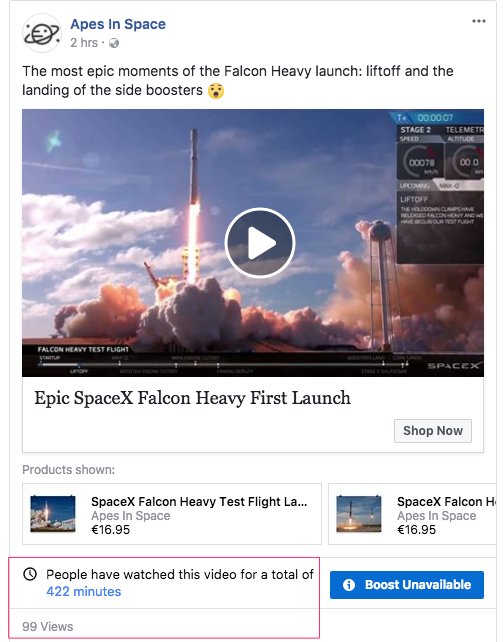
The retargeting campaign with dynamic product ads targeted visitors that had looked at a product in the last 7 days:
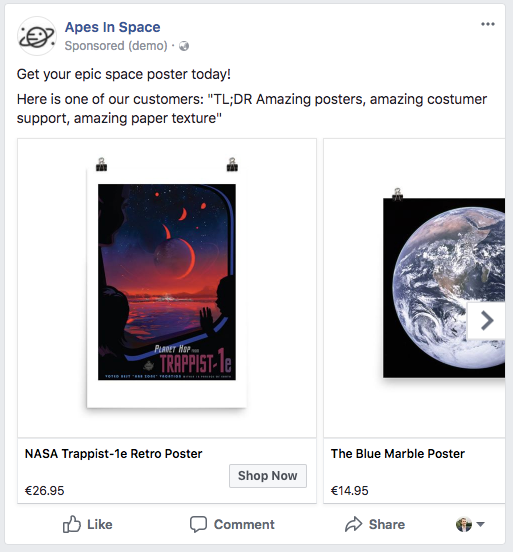
These ads were the ones that brought in the sales for Facebook ads.
Here are the results:
- Clicks: 2,817
- Cost per click: $0.17
- Cost: $497.25
- Orders: 2
- Revenue: $70.5
- ROAS: 0.14
I spent almost $500, reached over 100,000 people, got 2,800 visitors to the website but only made $70.5.
I admit I probably spent a little too much, but I figured that this launch probably was one of the biggest events of the year. So I believe spending a relatively low amount (ideally I wanted the CPC to be in the $0.05-0.1 range) to bring people in my target audience to the site wasn’t a bad call.
I still need to break into the market and create more awareness. But only time will tell 🙂
Instagram Ads
I also promoted the video above on Instagram:
After a few hours, I had spent about $49 at $0.6/click, so put those on hold as well. I probably should have paid more attention to how the video and thumbnail looked.
Twitter Ads
I also put out a tweet that did really well organically:
This is one of the most epic videos you’ll see for a while 😮 #FalconHeavy #SpaceX pic.twitter.com/jglEvil372
— Today’s Apes In Space (@Apesinspaceco) February 7, 2018
I hadn’t done any Twitter ad promotion yet, so was curious to what they could offer.
Their interface and campaign types were super confusing, all I could do was created a boosted video campaign (because my tweet didn’t have a link in it).
I figured it would make for a good test. But after about an hour I saw that I already I spent €7.87 for 105 video views, about €0.07/ view. That was very disappointing since my tweet was going semi viral and was racking up thousands of views for free. So I paused the campaign.
Social media follower counts
- Twitter followers: 52 (+47 vs January)
- Instagram followers: 44 (+27)
- Facebook likes: 244 (+167)
Shopify apps
Here are the Shopify apps I used in February:
- Privy: popups
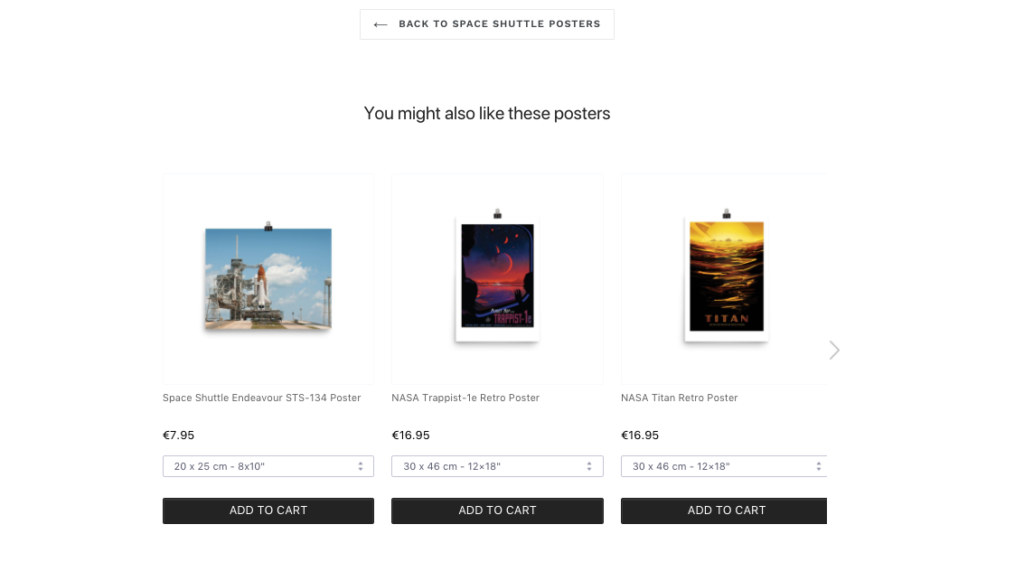
- Beeketing personalized recommendations:

- Beeketing Sales pop: I mainly use this for the social proof since I’m don’t have a lot of reviews yet. But it’s not very effective, only 11 people clicked on it in the last 30 days.
- Product Filter & Search: I installed it but felt it didn’t really enhance the visitor’s experience. But I let it go past the free trial which caused NONE of my products to show. Luckily someone pointed this out to me. Since I was in a hurry I upgraded to the paid plan of $19/month. This is really wasted spend so I need to remove this again from my theme. (update: they actually had a Revert Install option in a menu in the app which took 3 seconds 🙈)
Google Analytics
I haven’t talked much about Google Analytics in these updates. That’s not because I don’t use it (I probably check it much too often, especially during that launch :p) but it’s because it hasn’t been truly useful till now.
With more data coming in, and multiple traffic sources, it also becomes harder to see what is working. That’s not helped by apps like the Beeketing ones that add their own UTM parameters to links within the website. That really screws with visibility.
Take a look at the traffic sources report with the ecommerce transactions:
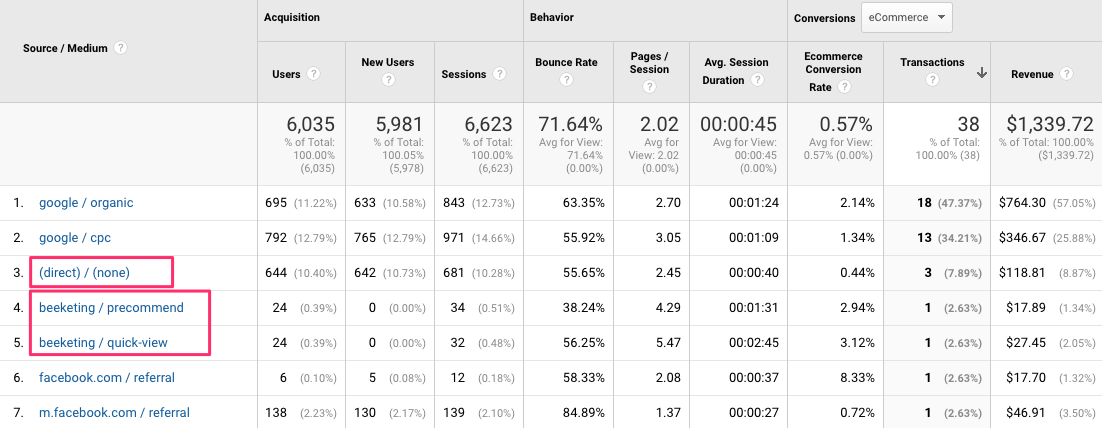
The sales from organic, google / cpc (= Adwords) are pretty straight forward.
The 3 direct sales are probably visitors that have clicked through from a coupon email. I still need to add UTM parameters to those links.
But what really bothers me are the sales attributed to beeketing. This only tells me that they clicked on a beeketing thing while they were on the site. But the most important information, where they came from originally, is missing from this report.
Here is one way to try and piece that information together: the Assisted Conversions report!
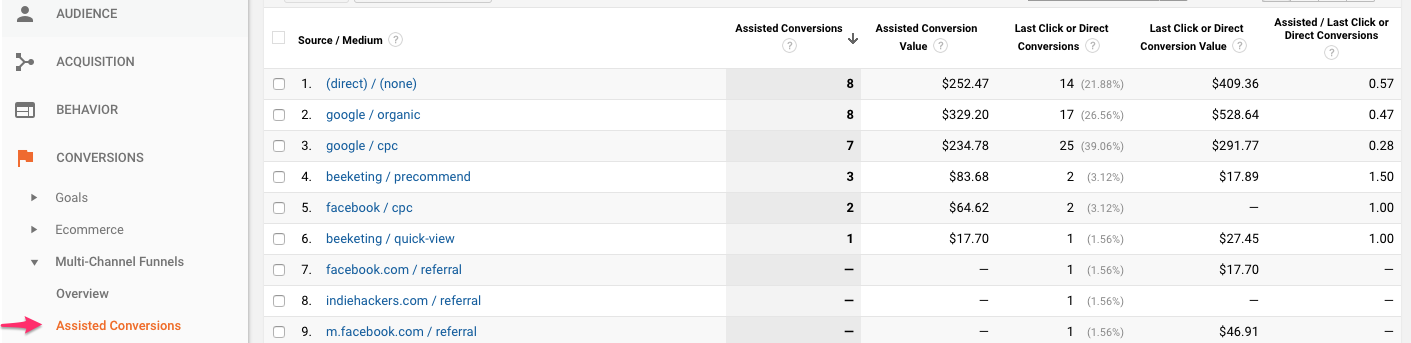
Assisted Conversion report in Google Analytics
This is a pretty advanced report. But it shows the interplay between the different channels. Because there are so many assisted conversions, it’s clear that the path to a conversion is a lot more complicated than we think off.
Anyway, just wanted to touch on that 🙂
💰 Financials
So here is where it gets juicy. There are finally a a good amount of sales to make this section more interesting.
Here is what the financials for February look like:
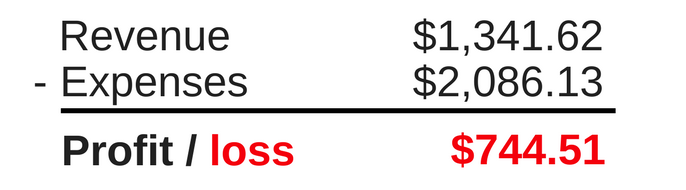
Detailed breakdown:
Revenue: $1,341.62
Expenses: $2,086.13
- Printful product, logistics and taxes: $831.04
- Shopify basic plan: $29
- Shopify transaction fees: $24.01
- Stripe transaction fees: $25
- Google Adwords spend: $578.21
- Facebook Ads spend: $497.25
- Instagram ads spend: $49
- Twitter ads spend: $9.63
- Privy: $24
- Product filter app: $19
Profit / loss = Revenue – Cost = -$744.51
This is a pretty steep loss.
Most of that is because of out of control spending on ads, which really hurt profitability.
If I take out the ad spend, expenses drop to $952.04, which would show $389.58 in profit. (I know it doesn’t work like that but it is interesting to explore).
A lot of this is about experimentation and trying things I couldn’t do otherwise. But for it to become a lasting business, I need to make it profitable.
So going forward I’ll have to keep my ad spending urges under control 😅 and seriously decrease my expenses. That means sticking closer to my strategy of organic + paid.
📦 Merchandise
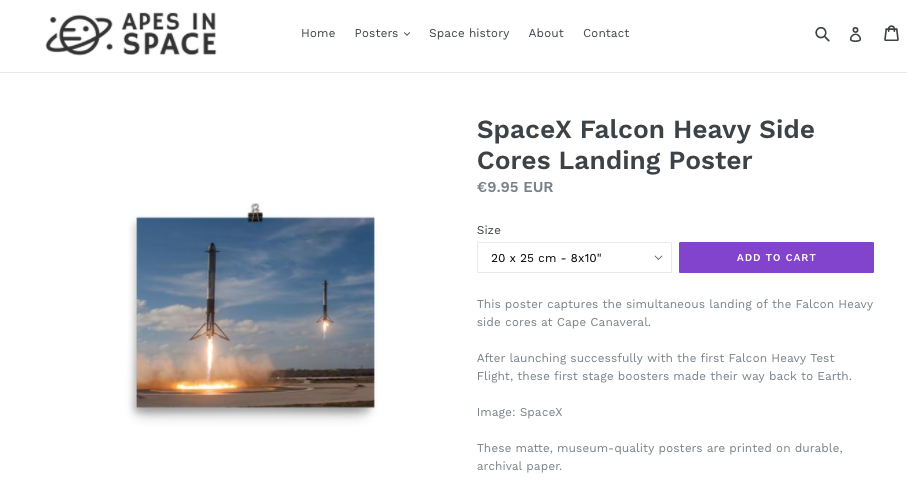
I added about 10 new posters in February, the total is now at 86 posters.
Most of the new ones were related to SpaceX, their recent and older launches. Like this one of the side boosters landing, which has become one of the most popular products:
⏱ Effort
Here is how much time I spent on running my online store in February:
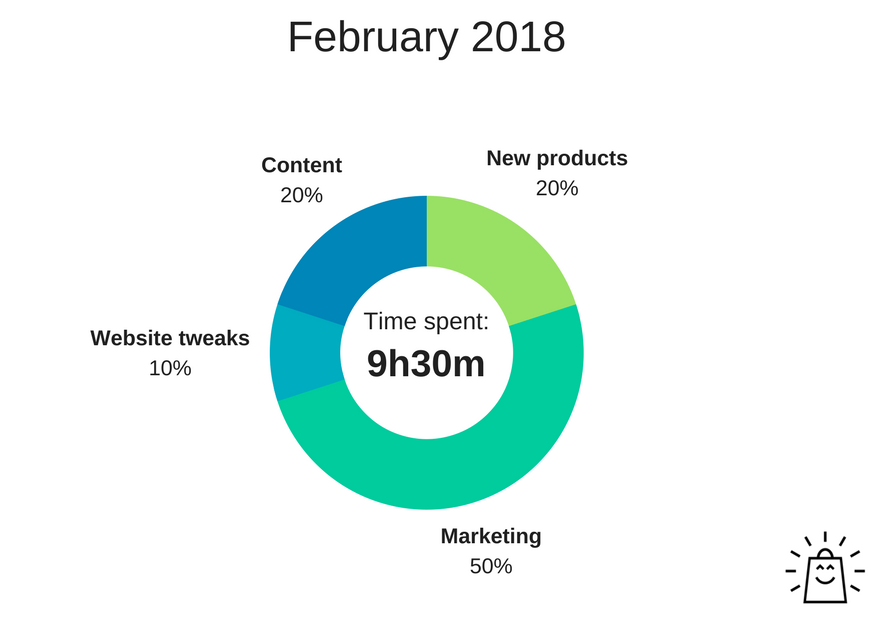
I spent a bit less time on the store compared to the previous months. The time I did work on the store was mainly spend in the two weeks around the launch.
After I had to get back to other ongoing work and didn’t have that much time left.
😶 Psychology
February has been a rollercoaster ride for this project.
Coming up with the idea, executing hard and then seeing the sales come in was very rewarding. This rush of sales is the first big win. It showed that with the right products and right timing this business can really make a lot more.
That made me feel very inspired and motivated to work.
But in all that buzz I also got carried away with the ad spend. I knew the rough amounts I had spent, but didn’t realize how much it was when added up.
It feels hard to put the actual numbers out there for everyone to see. And because it hurts it’s probably a valuable lesson to be more frugal and watch my expenses more closely. 😬
Because I have another business that’s funding this project, I havent cared too much wether this site makes money. But if I didn’t have this cushion, it would be a different story. This takes away some of the pressure to earn, but might have taken it a bit too far.
I think this is also the big difference with the work I’m doing here, and the projects that I’m taking on with clients.
When I come in, most clients have a good foundation (customers, products and systems) that brings in money and allows for new experiments. My goal should be to get Apes In Space to that level. So any money it spends actually comes from the business itself.
I guess Jeff was onto something:
“Frugality drives innovation, just like other constraints do. One of the only ways to get out of a tight box is to invent your way out.” — Jeff Bezos
Guess I’ll put on my innovator hat for the coming months 🙃
So if you’re getting value from any of this, be sure to leave me a comment or send me a message 🙂
🚀 My goal is to consistently hit $1,000 / month in sales by end of December 2018. That’s only 10 updates away so be sure to sign up for future updates to follow the progress!
Other updates in this series: Launch – Month 1 – Month 2 – Month 3 – Month 4 – Month 5