On Google Ads, your competitors are very visible.
Every time you search for something related to your products, your competitors’ ads are right there, staring you in the face.
So it’s only natural that you want to find out exactly how much they’re spending, and more important, what they’re making from their Google Ads campaigns!
That’s exactly what we’ll do in this article!
Key Competitor Insights
When it comes down to doing competitive research for Google Ads, there are a couple of important questions:
- Which competitors are advertising on Google Ads?
- How many visitors do they get?
- How much are they paying for these visitors?
- What campaign types are they using?
- What are their most popular keywords?
- What do their most important metrics look like? (Revenue, AOV, CAC & LTV?)
This is not theoretical knowledge. I’ll break down the exact research process that I use to create Google Ads breakdowns of brands that spend millions of dollars per month.
1. Which competitors are using Google Ads?
The easiest way to discover who is advertising on Google Ads is to just search for a couple of keywords and see which advertisers show up.
That’s a good start, but know that this approach might only show part of the playing field:
- Geography & language: the results are limited to the location and language of your browser (tip: use iSearchfrom or a VPN provider to get around this)
- Keywords: some competitors might only advertiser on certain types of queries
- Schedule: advertisers can configure their ads to only show during certain times. So repeat your search at different times of the day and days of the week.
- Ad budget: Their budget might be exhausted, causing them not to show up during that time of the day
- Bids: advertiser might want to show up, but they’re being out-competed by brands that are willing to pay more for a click
At this stage, I create a simple list of advertisers that show up in the Search and Shopping results.
If you are already running Google Ads campaigns, you can find more detailed information about the advertisers that are showing in the same auctions than you are.
Google Ads Auction Insights
The Auction Insights report will tell you how you compare to other advertisers for your whole account, a specific campaign or ad group.
This method can give you pretty accurate data. You’ll know which advertisers you’re competing with, and how aggressive they are.
Here is a look at the Auction Insights report for a campaign of one of my clients:
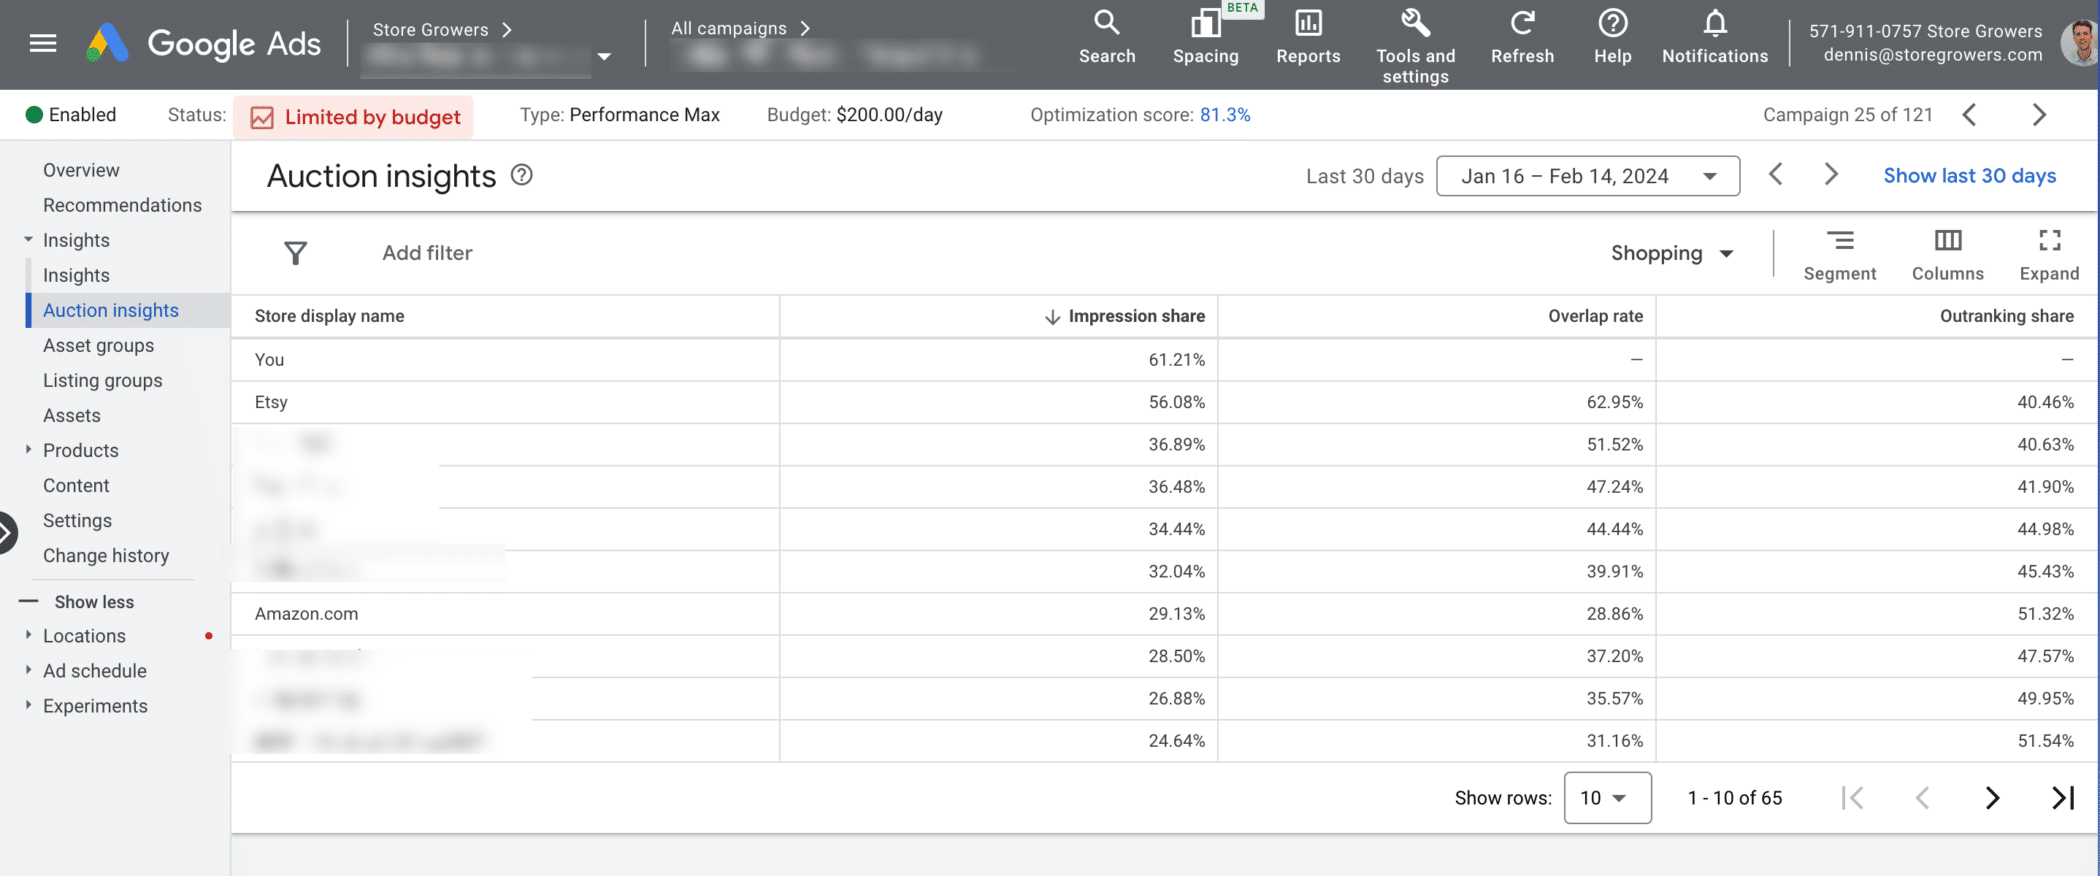
This screenshot the breakdown of other advertisers that show their ads together with this particular Performance Max campaign. (You can see these breakdowns for Search Ads, Shopping Ads as well as pMax)
In the first column of the table, you can see all the other advertisers, I’ve blurred most out for confidentiality reasons but you can see a couple of big stores like Etsy and Amazon.
What you’re looking for in this report is actionable information that you can use in your advertising campaigns and business. For that reason, I leave big competitors like Amazon or Temu out of the research.
So if you sell outdoor furniture, you need to look into other outdoor furniture stores, not a store like Walmart which sells a bit of everything.
There is a bunch of extra information you can pick up from this report, which I’ll cover in the next section.
2. How much Google Ads traffic do your competitors get?
Now that we know which advertisers are showing up in the Google Ads auction, it’s time to take a closer look at the amount of visitors they’re getting.
First, I’ll cover which tools you can use if you’re not running any Google Ads campaigns.
An important thing to mention here is that all the data you find in these third-party tools are estimates, not the actual visitor numbers. Most of these tools rely on data coming from browser plugins, themes, toolbars, hosting providers, ISPs, etc. Then they use these raw data to estimate what that looks like in general.
A good benchmark is to plug in a few website that you have access to, and see how the estimates compare to the real numbers.
Tool: Similarweb
Similarweb gives you an overview of the number of visitors and traffic sources for a particular domain.
It used to be my go to tool to find traffic information. But recently they removed their free plan. All they offer now is a 7-day trial (without credit card), after the cheapest plan costs $125/mo.
That’s pretty expensive if you’re not using the tool daily, but you can use the free trial to get your research done at least once 🙂
Here is how I would use the tool for ecommerce brand FIGS.
First we start we the general traffic numbers:
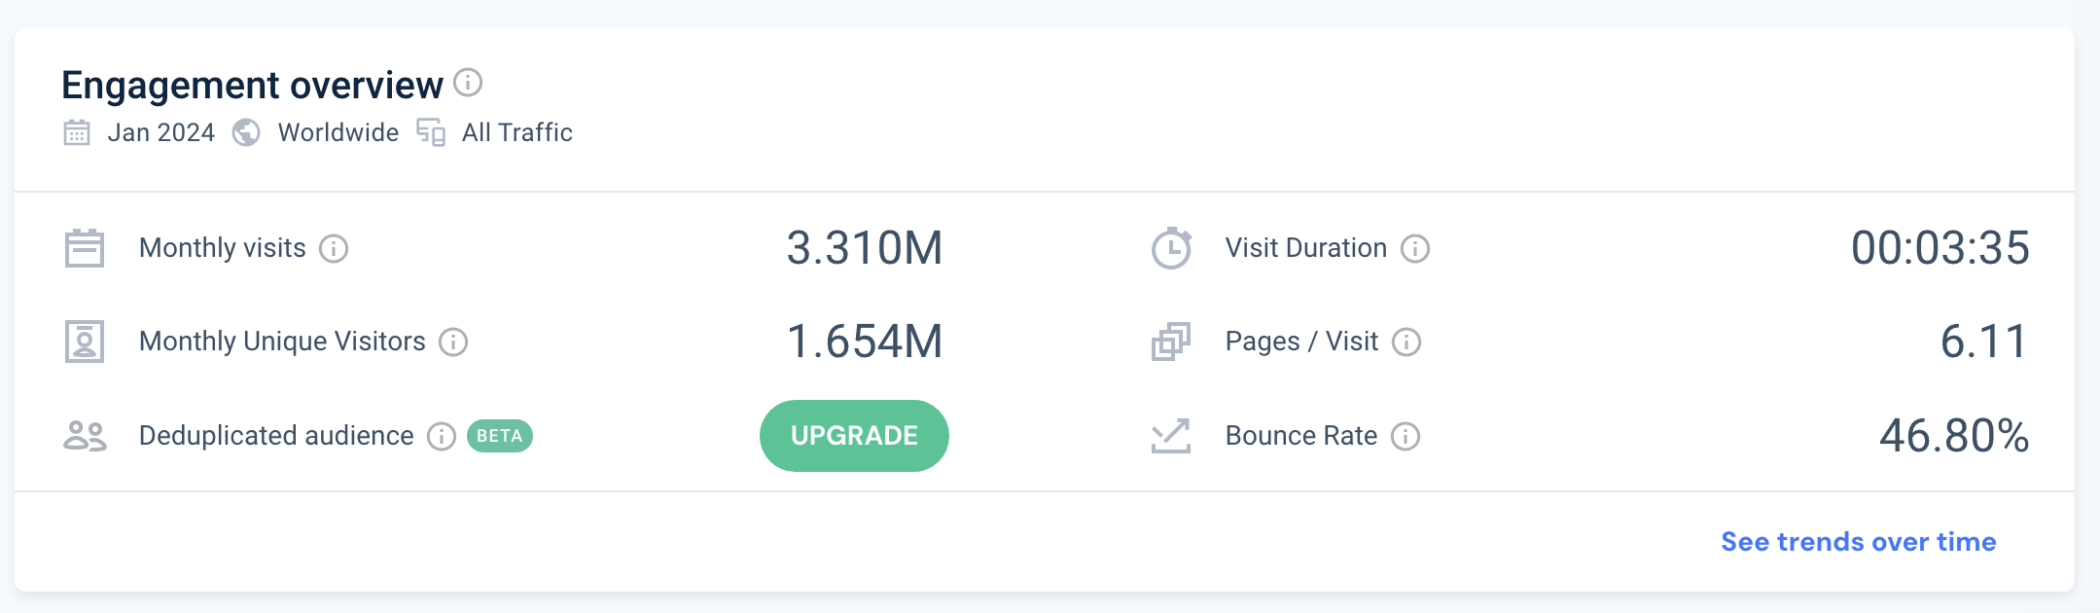
The domain wearfigs.com had 3.31M visitors in January 2024.
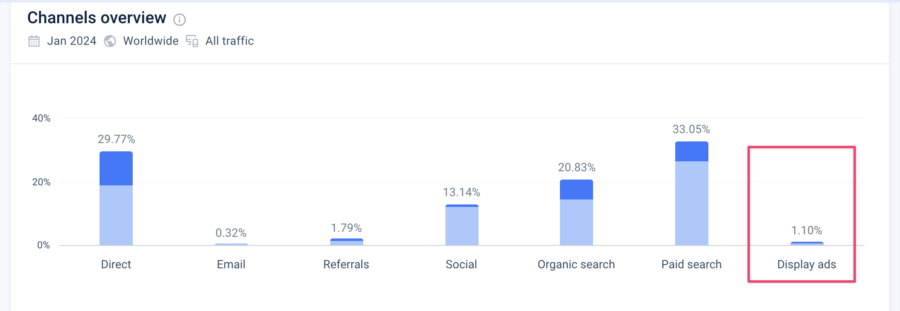
Next we use the Channels overview report to get an idea where these visitors were coming from:
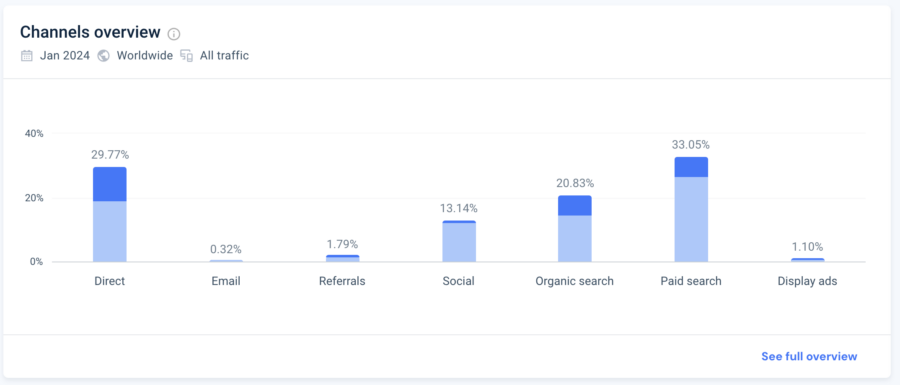
Here, we can see that 33% of traffic to the site comes from Paid search, and 1.1% from Display ads. Direct accounts for almost 30%, which is usually a mix of all the other channels.
So if we do the math: 3.31M * 33% = 1.09M visitors from paid search
Note that Similarweb works well for big sites that get a lot of traffic, for smaller sites it often doesn’t have data or it’s inaccurate.
Tool: Semrush
Semrush is a tool that focuses on keyword research for SEO and PPC.
If you create an account you can use a limited free version, and their plans start at $129/mo.
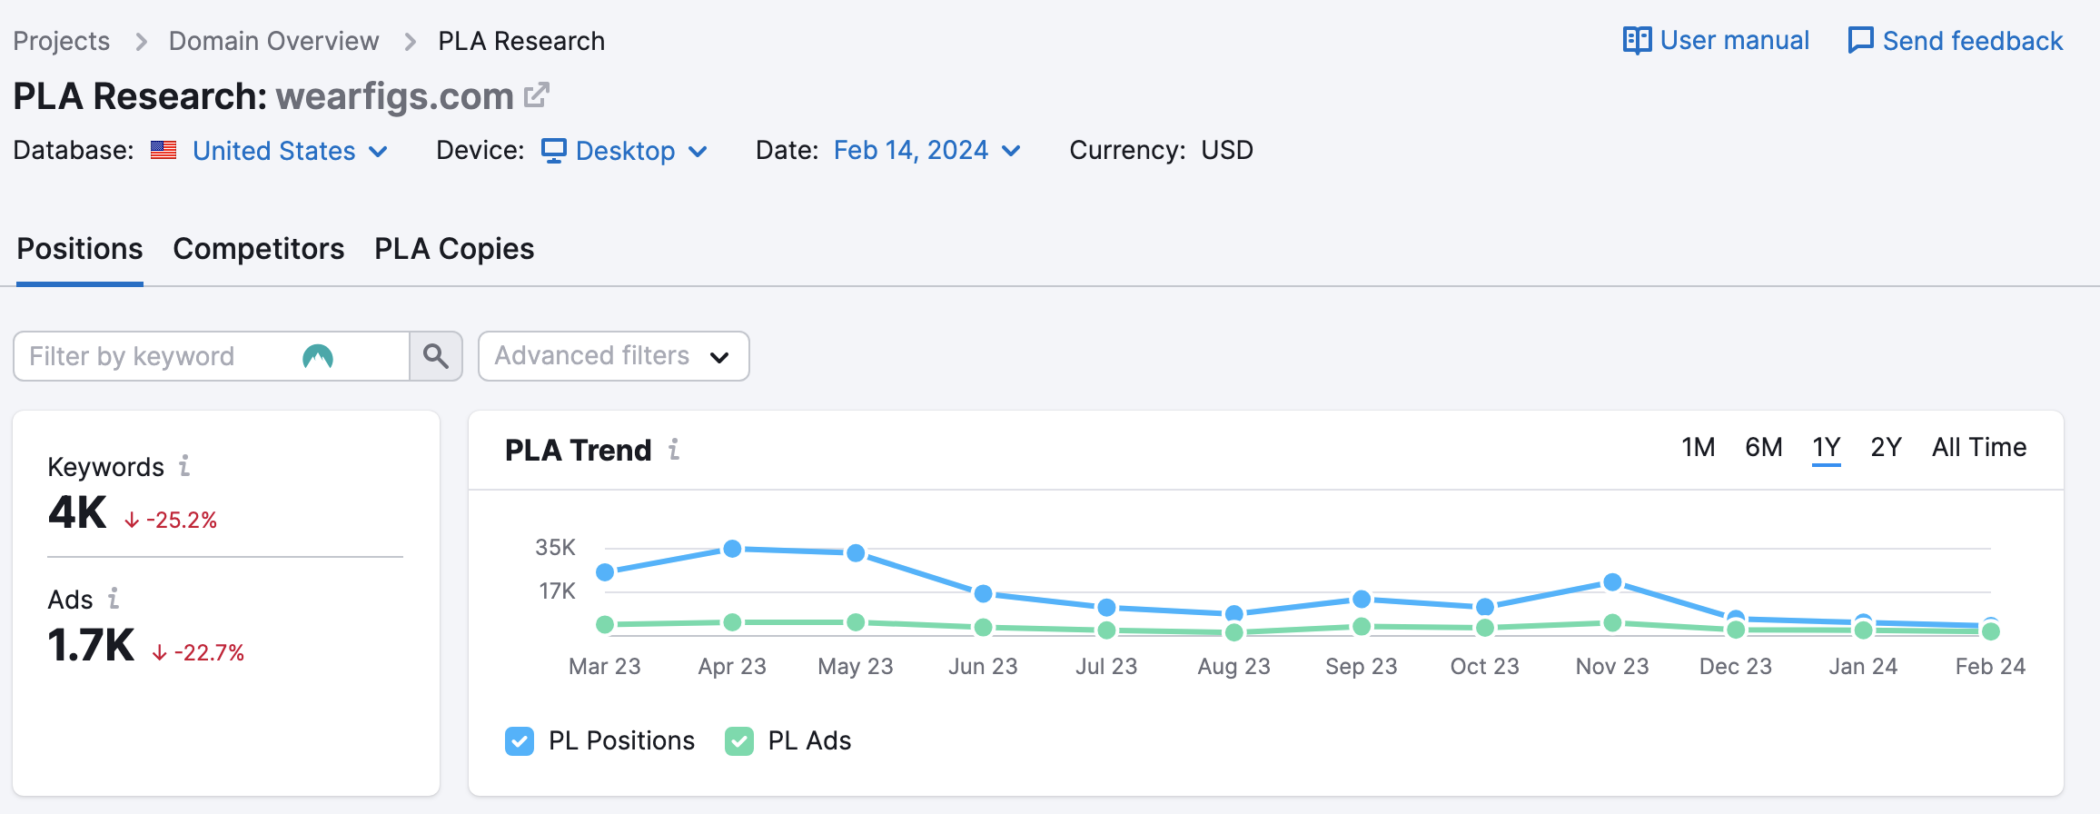
Let’s look at the same brand as we did in the previous section:
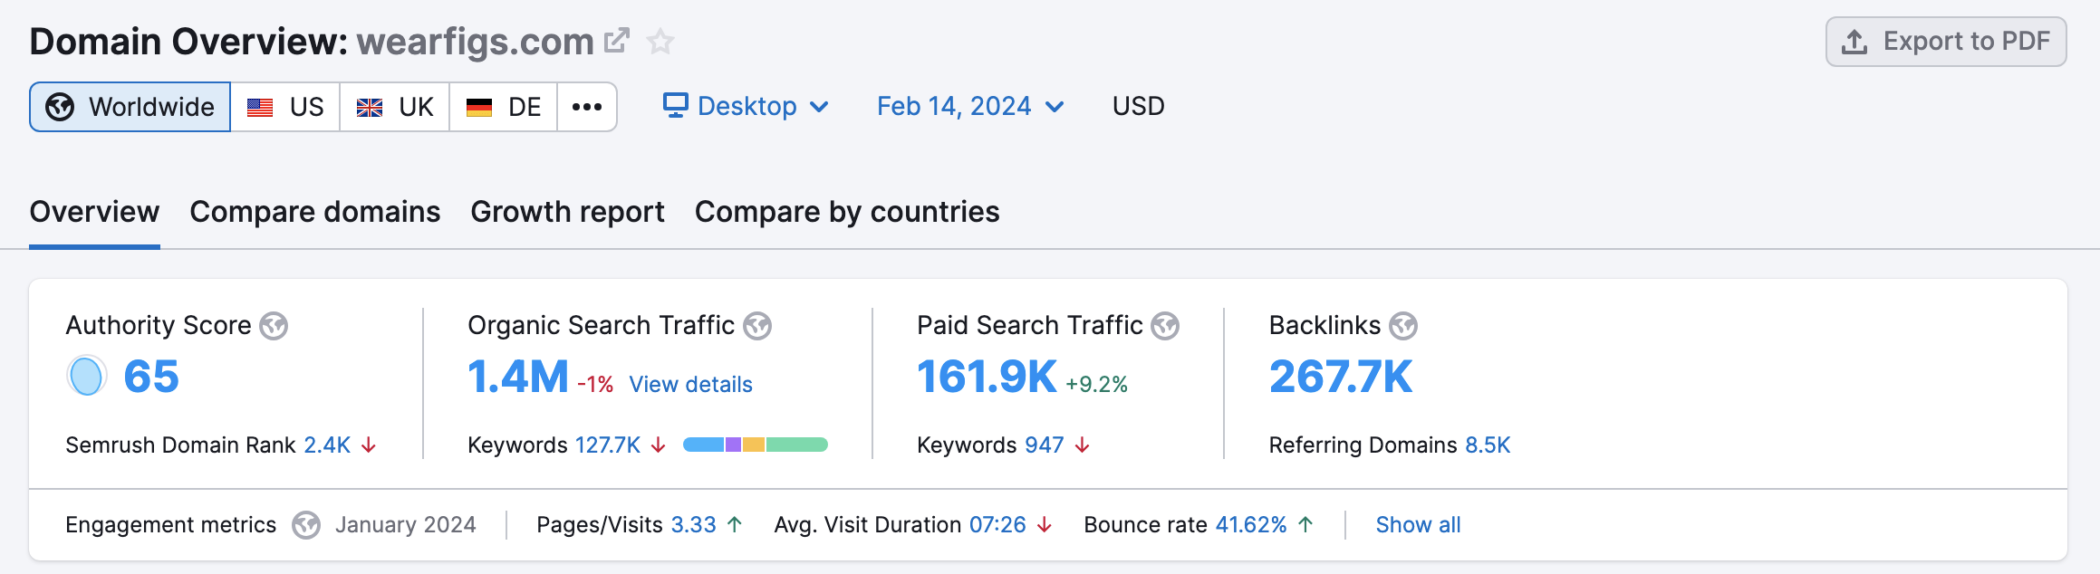
Semrush doesn’t give the overall traffic volume, just the organic vs paid search traffic breakdown.
In this case, the tools estimates FIGS gets a total of 162,000 visitors from paid search. That’s just 10% of the numbers that Similarweb claimed.
Tool: Ahrefs
Ahrefs is another keyword research tool that’s mainly focused on SEO.
They have a free version if you connect your own Google Search Console, which allows you to see data related to your own site. But if you want to research other keywords and domains, you need to be on a paid plan that starts at $99/mo.
The keyword research and data are similar to Semrush, but it’s pretty limited in terms of its PPC functionalities.
Other third-party tools
Previous versions of this article mentioned tools like SpyFu, KeywordSpy and iSpionage. In the past these were solid tools to get information from, but as of 2024, these tools are outdated in terms of data and functionalities.
Tool: Google Ads Auction insights
If you’re running Google Ads campaign, the Auction Insights I’ve mentioned above are a great source of information.
Let’s look a bit closer at this report to see if we can get traffic estimates.
Out of all the data in this report, these are the most important metrics:
- Impression share: what percentage of the time did you show up vs all the potential impressions?
- Outranking share: what percentage of the time did you outrank the other advertisers?
Let’s look at an example:
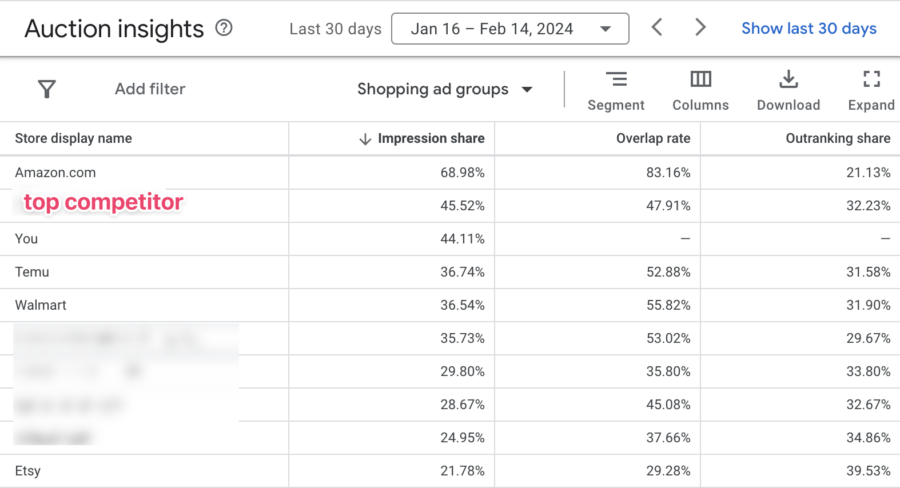
Amazon has the highest Impression Share of all advertisers with these same set of keywords. This store is showing up in 69% of all searches while this advertiser (= You) only shows 44% of the time.
Very rough math means that if this advertiser could get to that level of traffic, we would be looking at 50% more clicks and 50% the cost and potentially 50% more revenue.
Sidenote: if you’re wondering why your Impression share is so low, it’s probably a mix of budget that’s too low, your max CPCs aren’t high enough or your quality scores are lower than the competitors.
3. What campaign types are they using?
In most of the article, we’ve mainly covered Search Ads, which is what all the mentioned tools report on.
But to get a clear picture of the Google Ads strategy of a competitor, you need to get some insights into how much a brand is spending on Search, Shopping Display and YouTube Ads.
Important here is to mention that with this type of competitive research, you only see the end result. Meaning where the ads actually show. A text ad might have come from a Performance Max campaign, while a display ad at might originate from a Demand Gen campaign.
Spying on Shopping Ads
Technically, Shopping Ads are part of “paid search”, but none of the tools include it in their estimates.
Only Semrush has one report dedicated PLA report. In order to see it, you need to be on their most expensive Business plan, which costs $499/mo.
Frankly this report is underwelhming and not really worth it. It lists how many keywords an advertiser shows for and how many ads (= products) they’re showing.
To get around this, I developed a model that compared the metrics Semrush was reporting vs the actual stats from over 50 ad accounts I had access to. That allows me to guesstimate the traffic depending on the number of keywords/PLA copies.
Youn might not have access to as many data. But you could look at the split of Search vs Shopping clicks in your account, and extrapolate that to other advertisers.
Spying on Display Ads
To see if an advertiser is running any Display Ads, you can use the Google Ads Transparancy Center.
Tool: Google Ads Transparancy Center
This will give you an overview of all the ads that a certain advertiser is running.
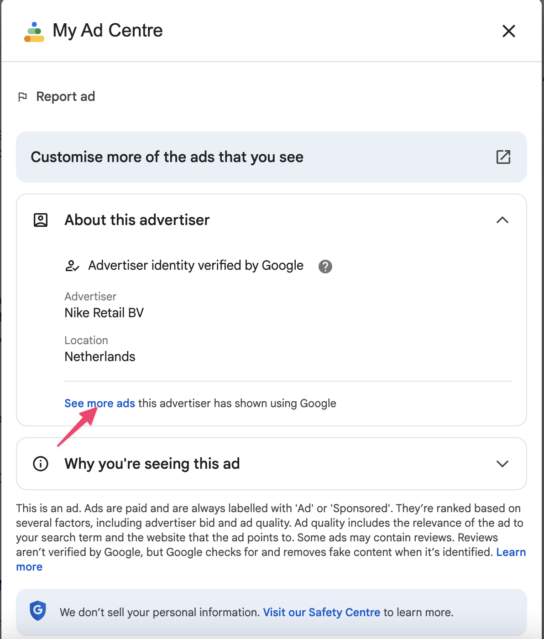
Here is how to get to it. Go to a Search Ad and click the 3 little dots next to the URL:
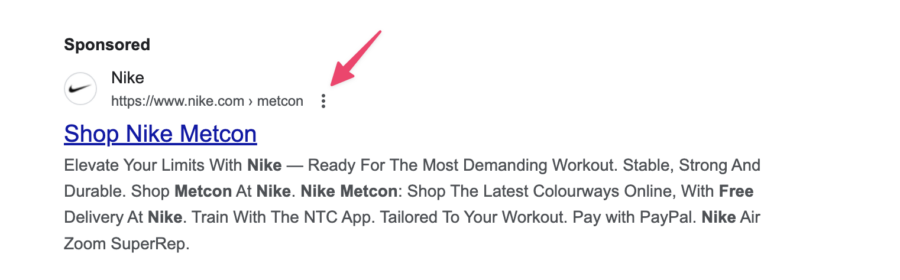
Next, click “See more ads”
This will show you the overview of all the Image, Text and Video ads that an advertiser is running.
Up top, filter it down to just Image ads:
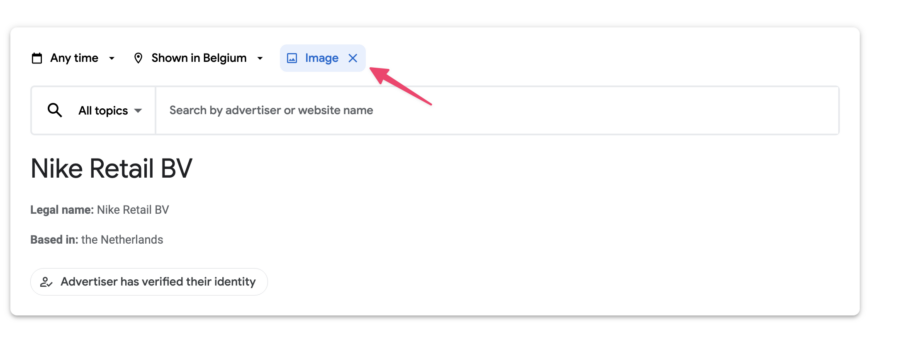
This will give you an overview:
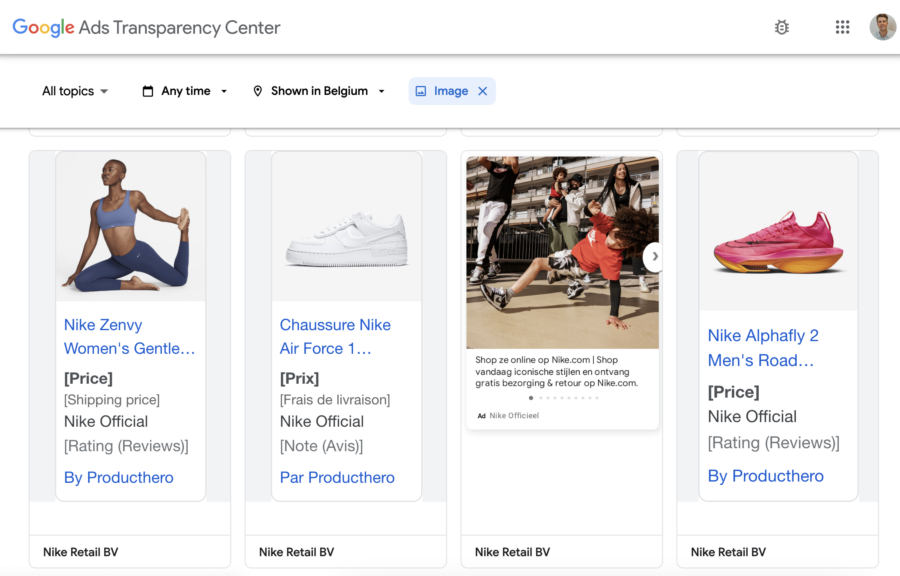
Recently Google started including all Shopping Ads into this list, so you might have to scroll down until you actually come across a realy image ad.
This should give you an overview of the type of ads that they’re running.
But it won’t tell you how much traffic these ads are generating.
Semrush used to have a good report on Display Ads, but they removed this feature. Similarweb does have the estimate of how much traffic is coming from Display:
You can calculate what number of visitors that works out to.
Spying on YouTube Ads
If you want to see which Video ads an advertiser is running, you can start with the Google Ads Transparenecy Center I just showed you:
Note that Local Ads and App install Ads that have a video attached to them will also show up in this overview.
To get an idea of how many views these ads are generating, you can either keep track of the view count in YouTube, or use a dedicated tool like Vidtao to help your research.
Tool: Vidtao
Vidtao is a tool that helps you to do competitive research on YouTube.
Here is for an example an overview of all the YouTube ads that FIGS is running:
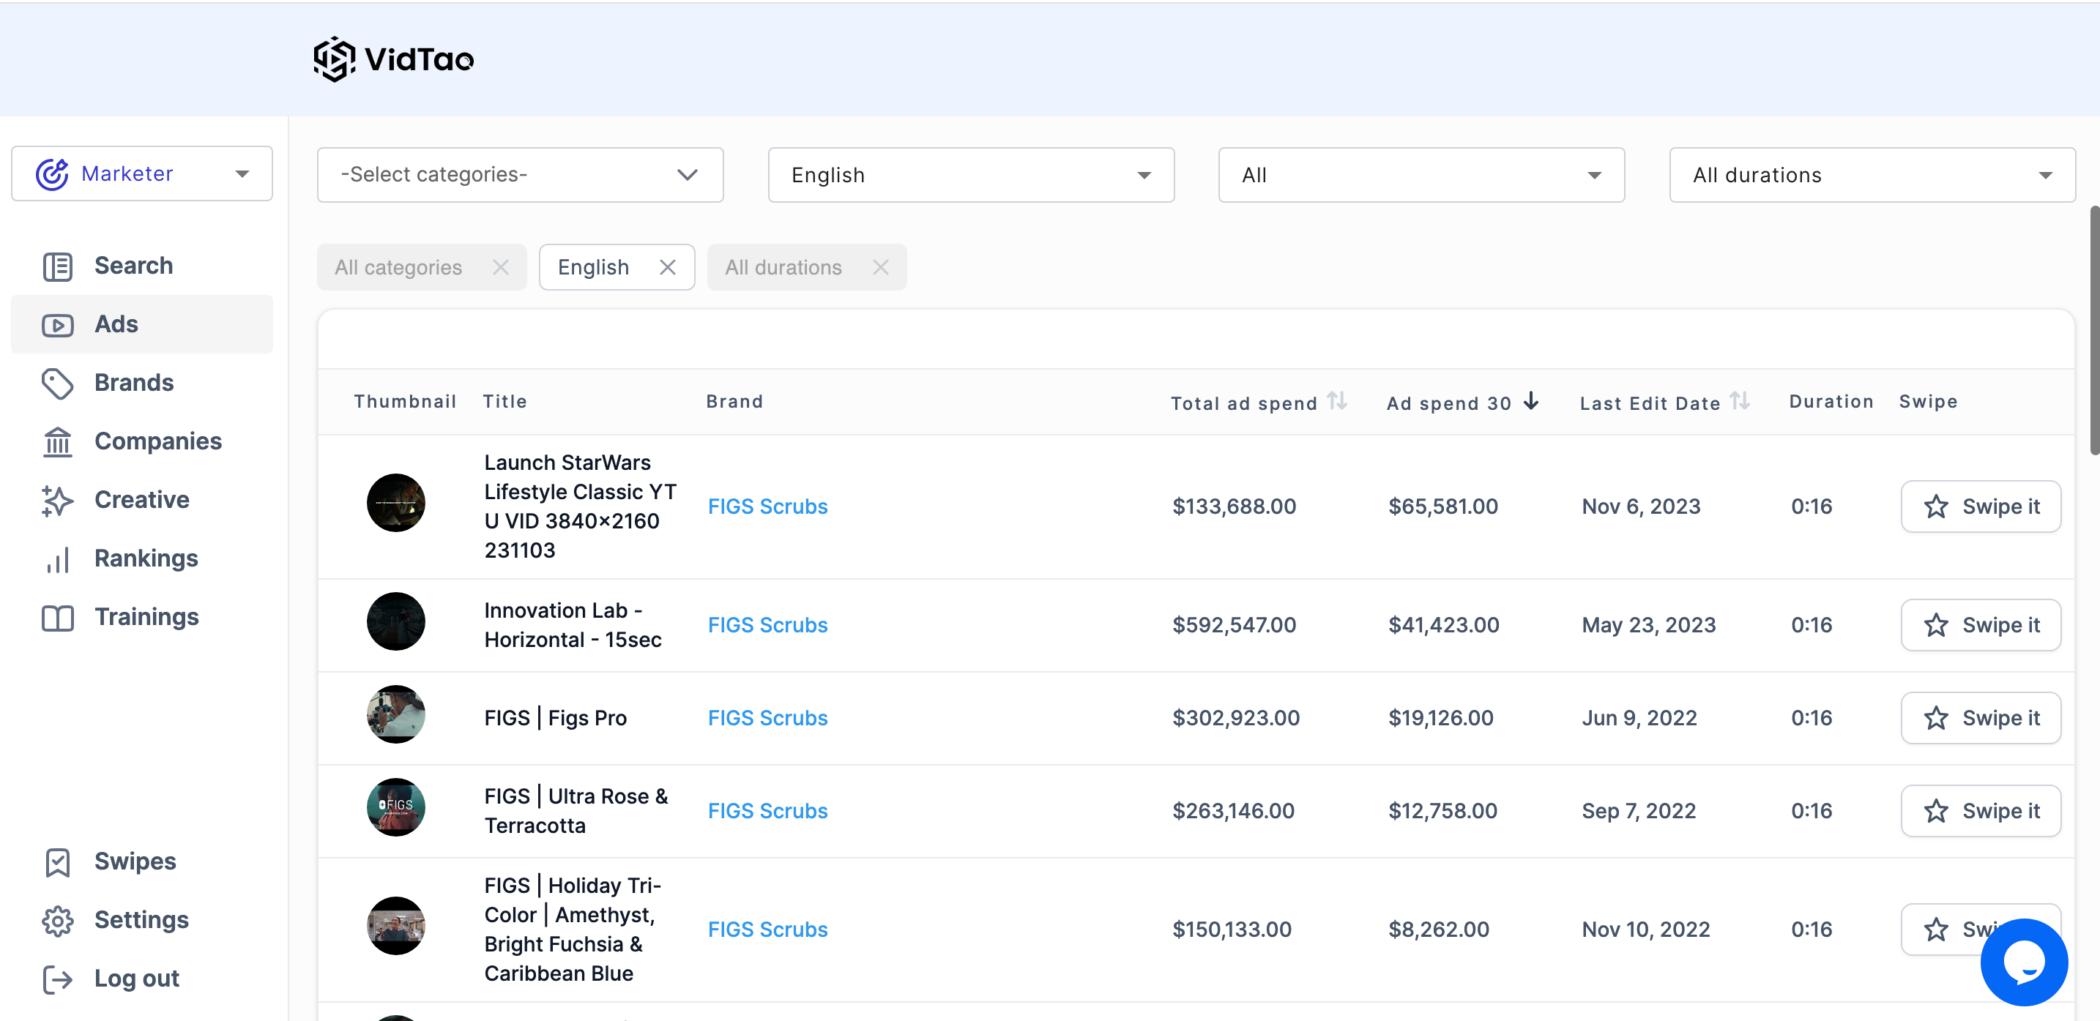
Not only can you see the actual ads, you can see how money has been spent in the last 30 days, giving you a good idea about their YouTube Ads strategy.
4. How much are they paying for these visitors?
At this point, you should have a rough estimate of how many visitors your competitor is getting for each ad type.
Next, let’s figure out how much they’re spending on Google Ads.
I keep this prety simple, I have a good overview of CPC benchmarks:
- Search Ads CPC: $2.69
- Shopping Ads CPC: $0.66
- Display Ads CPC: $0.63
- YouTube Ads CPC: 0.49
There are lots os reasons why a particular advertiser might have a higher or lower cost per click, so in some cases you can get more granular.
But to keep things simple, just multiply the number of visitors with the CPC to get an idea of the monthly spend.
Before we look at how to estimate a competitor’s revenue, let’s take a look at their top keywords.
5. What are your competitors’ top keywords?
One of the things that’s super interesting is to dig a little deeper and see which Google Ads keywords your competitors are using on.
Of all the tools I’ve mentioned in this article, Semrush probably is the best tool to research keywords for Google Ads.
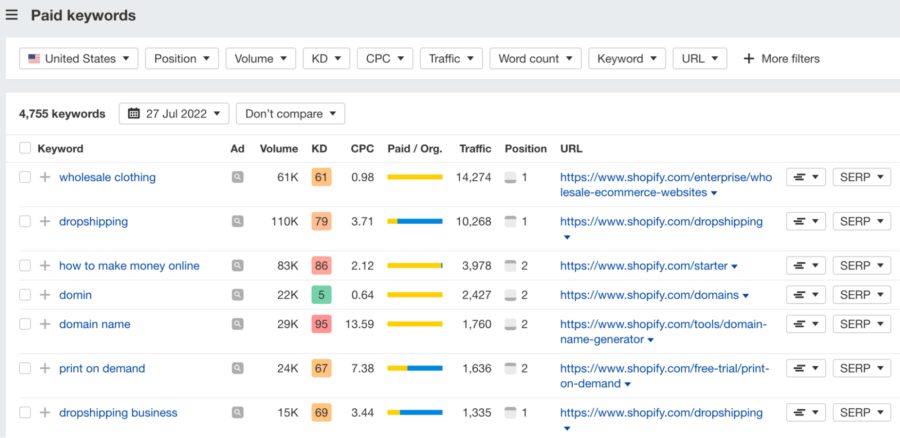
Here is the paid keywords report for FIGS:
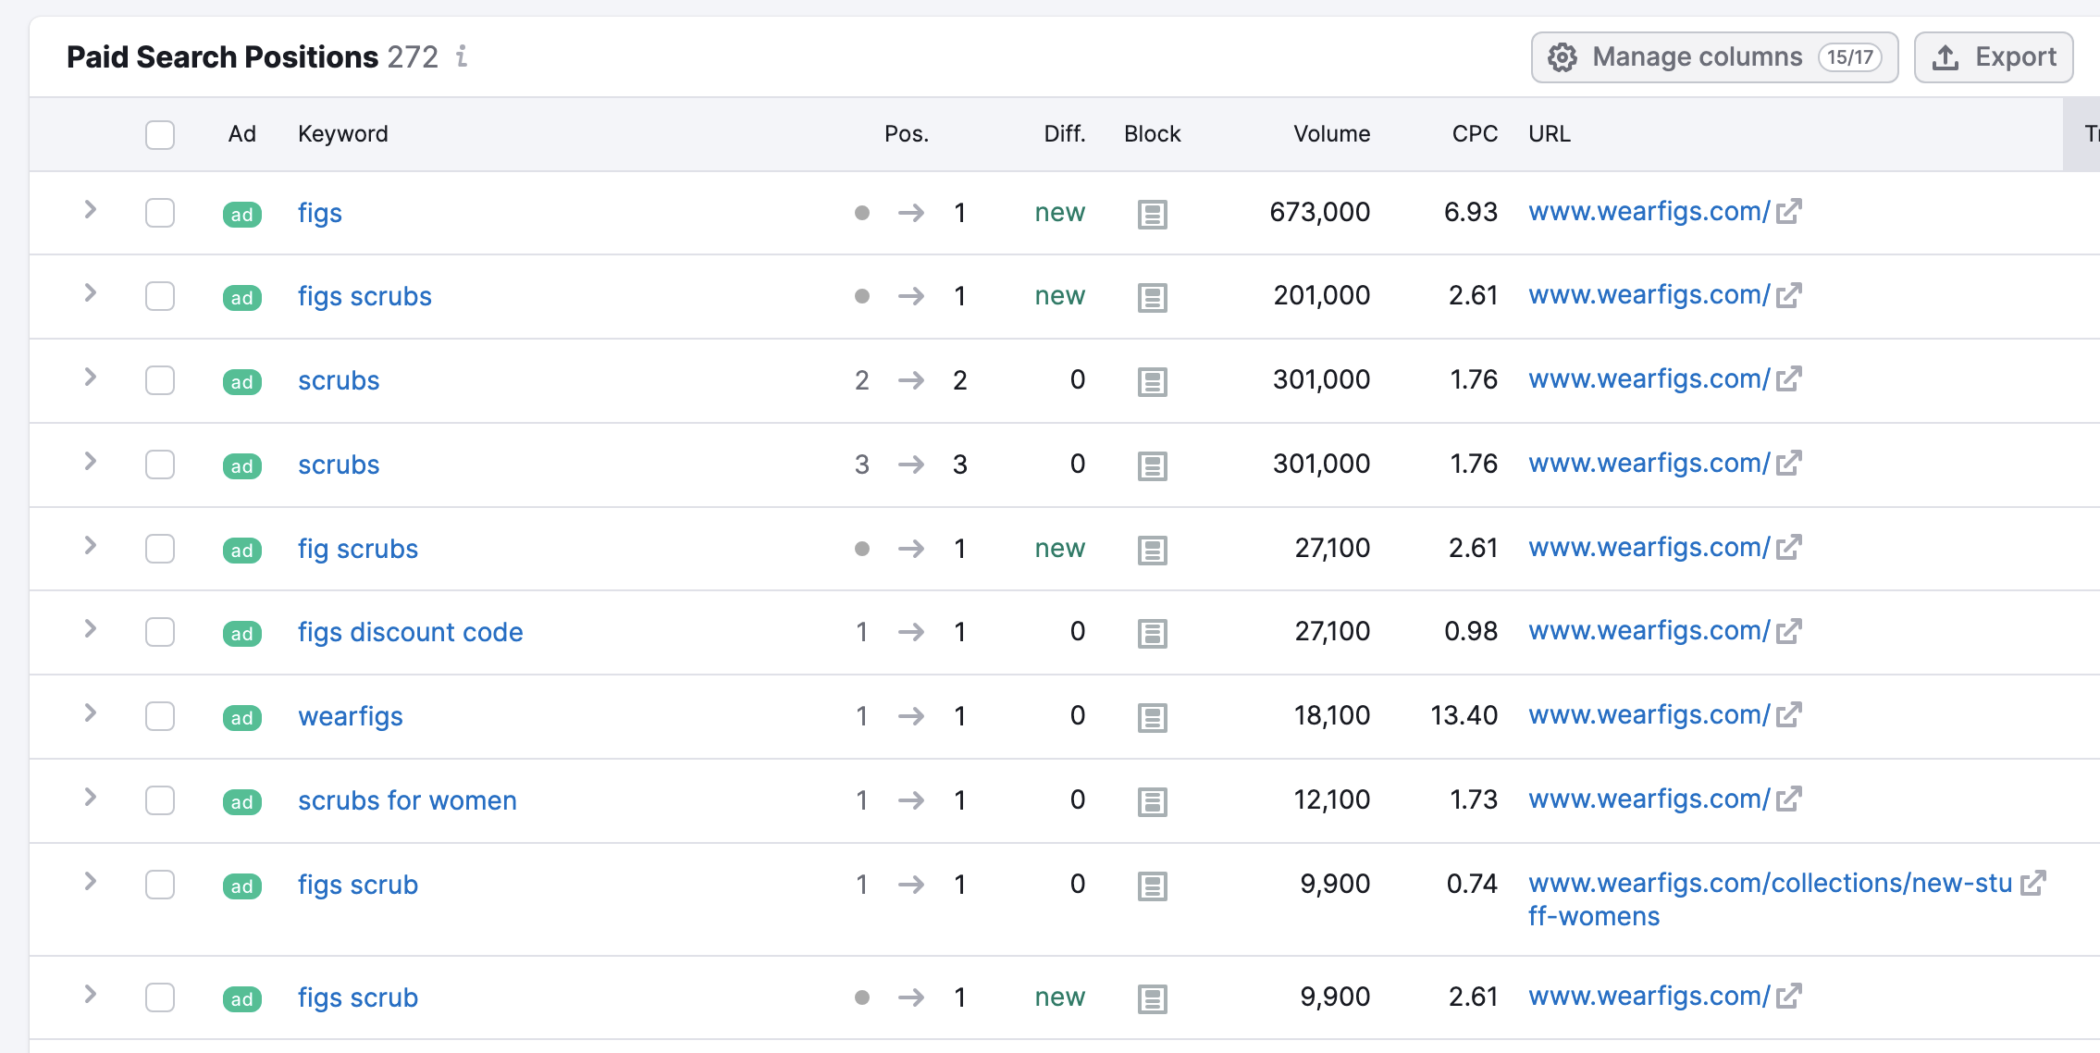
It starts with the basics: which keywords, the monthly search volumes and their estimated CPCs. The last two columns give you more insights into the role of a specific keyword for an advertiser.
The traffic % and cost % allow you to quickly focus on the most important keywords.
Knowing which keywords are most popular for a brand is interesting, but it would be even more interesting to know how profitable these search terms are.
Here is my rule of thumb, from most to least profitable keywords:
- Type 1: Store brand keywords: searches for the store’s name
- Type 2: 3rd-party branded keywords: searches for the brands and products that a store sells
- Type 3: specific non-branded keywords: detailed searches for products
- Type 4: general non-branded keywords: very broad category searches
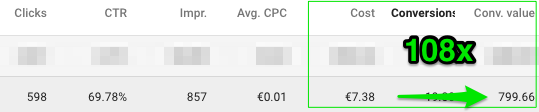
As I said, the most profitable searches in any account are those for the store’s brand. These branded keywords have an ROI of 50-300x. Many stores are hesitant to advertise on them, but the cost is so low that they often are a good investment.
But this can also work if you’re competing with that brand.
If you see a competitor with a large amount of branded keywords, you could try to set up a campaign to target keywords in these competitor searches with your ads. While it’s easy to steal clicks in this way, the orders don’t often follow.
It can work for some brands, but in most cases, competitor branded keywords are out of reach.
A better approach is to use Google to try and discover the type 2 and type 3 keywords from a competitor.
Try to see which products and brands they are advertising on. And how long they’ve been advertising on them.
That’s a good start to judge the profitability of a keyword. But as I said before, this logic doesn’t always hold up. Some advertisers will continue to plow money into unprofitable keywords for many years.
6. How much money are your competitors making from Google Ads?
Here is where analyzing Google Ads gets complicated (and very interesting!).
When two advertisers sell the exact same products, run the exact same campaigns, ads, and keywords, the results can still be different.
A lot of it has to do with how effective the website is at selling and how well it can convince buyers to purchase again.
Let’s say Advertiser A has a conversion rate of 3% while Advertiser B is 1.5%. If everything else stays the same, Advertiser A will be able to bid a lot more for each click than Advertiser B.
It’s a very simple example but already shows the impact of the underlying metrics on the Google Ads performance. Here are the most important metrics:
- Monthly revenue
- Conversion rate
- Average order value
- Customer acquisition cost
- Repurchase rate
- Customer lifetime value
Obviously, these are very valuable metrics, so most companies don’t share these data.
And I have yet to encounter a tool that will show me these metrics, so here are my (creative) tips to get them.
Google rep
I used to be an official Google Partner and as part of this program, I had a Google rep I could call when I need input for new clients or campaigns.
The higher the budget of the (potential) client, the more info they’ll provide.
So for a new client, I was able to get the customer acquisition cost of the top 5 players in their industry. The data was anonymized but still. Since my client had been advertising in this market before, we had a pretty good idea about the cost per click, which allowed us to work backward and figure out the revenue numbers for all of these players.
This really helped us to put together a list of targets to guide our optimizations.
So if you’re already advertising or looking to get started, call them up and simply ask them for this info.
Insider knowledge
Take a look at the social media profiles of the people that work for your competitor.
Also check if they’ve recently done any keynotes or webinars.
They won’t spill the beans completely but they’ll often leave clues. This allows you to piece together the info you need.
Sometimes an innocent-looking tweet can be the key you need.
Networking
I’ve attended many conferences where I have run into chatty vendors or (ex) employees that share a little too much information. So listen closely when you bump into someone interesting. (This works extremely well if there is any alcohol involved 🙂
Benchmarks
If you don’t have a clue about which metrics you should be hitting and are getting nowhere by spying on your competitors, have a look at these ecommerce benchmarks.
For an example of how this approach works, check out my analysis of the Google Ads strategy from Allbirds: