Google Ads uses quality scores to judge the quality of your ad.
But is it still useful in 2026? Or is it an outdated and overhyped metric?
In this article, we’ll dive deep into what quality score is, and how to use it to improve your Google Ads campaigns
Table of Contents
What Is the Google Ads Quality Score?
Here is Google’s definition:
Quality score is an estimate of the quality of your ads, landing pages, and keywords.
Google
Quality score is a score between 1 and 10 for each keyword, and it influences how much you pay for each click (CPC) you receive on your ads.
The higher your Quality Score, the less you have to pay for a click.
(The actual system behind quality score is a little more complicated, but we’ll get to that later.)
Why did Google invent quality score?
One of Google’s main concerns is that the search results remain relevant for its users. That goes both for the organic and paid results.
If Google Ads was just about who could pay the most, it would open the door for advertisers to always show their ads, as long as they paid up.
Quality score adds another dimension to evaluate how relevant an ad is to a user’s search query.
In short, a good quality score makes Google happy, users happy, and advertisers happy 😊
What Are the Benefits of a Good Quality Score?
The most important benefit of a good quality score is that you pay less for a click.
To see the impact of the quality score on the cost per click, Google compares your quality score to the average, which is 5/10.
- If your quality score is 10, you’ll get a 50% discount on your CPC
- If your quality score is 9, you’ll get a 44% discount on your CPC
- If your quality score is 8, you’ll get a 37% discount on your CPC
- If your quality score is 7, you’ll get a 29% discount on your CPC
- If your quality score is 6, you’ll get a 17% discount on your CPC
- If your quality score is 5, you’re neither getting a discount or penalty
- If your quality score is 4, you’ll pay 25% more for that click
- If your quality score is 3, you’ll pay 67% more for that click
- If your quality score is 2, you’ll pay 150% more for that click
- If your quality score is 1, you’ll pay 400% more for that click
Keywords with a quality score between 6 and 10 get a cost per click discount, while advertisers with a quality score of 4 or lower to pay more for each click.
Example 1: your keyword has a 10/10 quality score, and you’re bidding a max CPC of $1.2. If you only had a 5/10 quality score, you would need to bid $1.68 for that same click.
Example 2: your keyword has a 1/10 quality score, and you’re bidding a max CPC of $3.5. If you had a quality score of 5/10, you would only need to be $0.87!
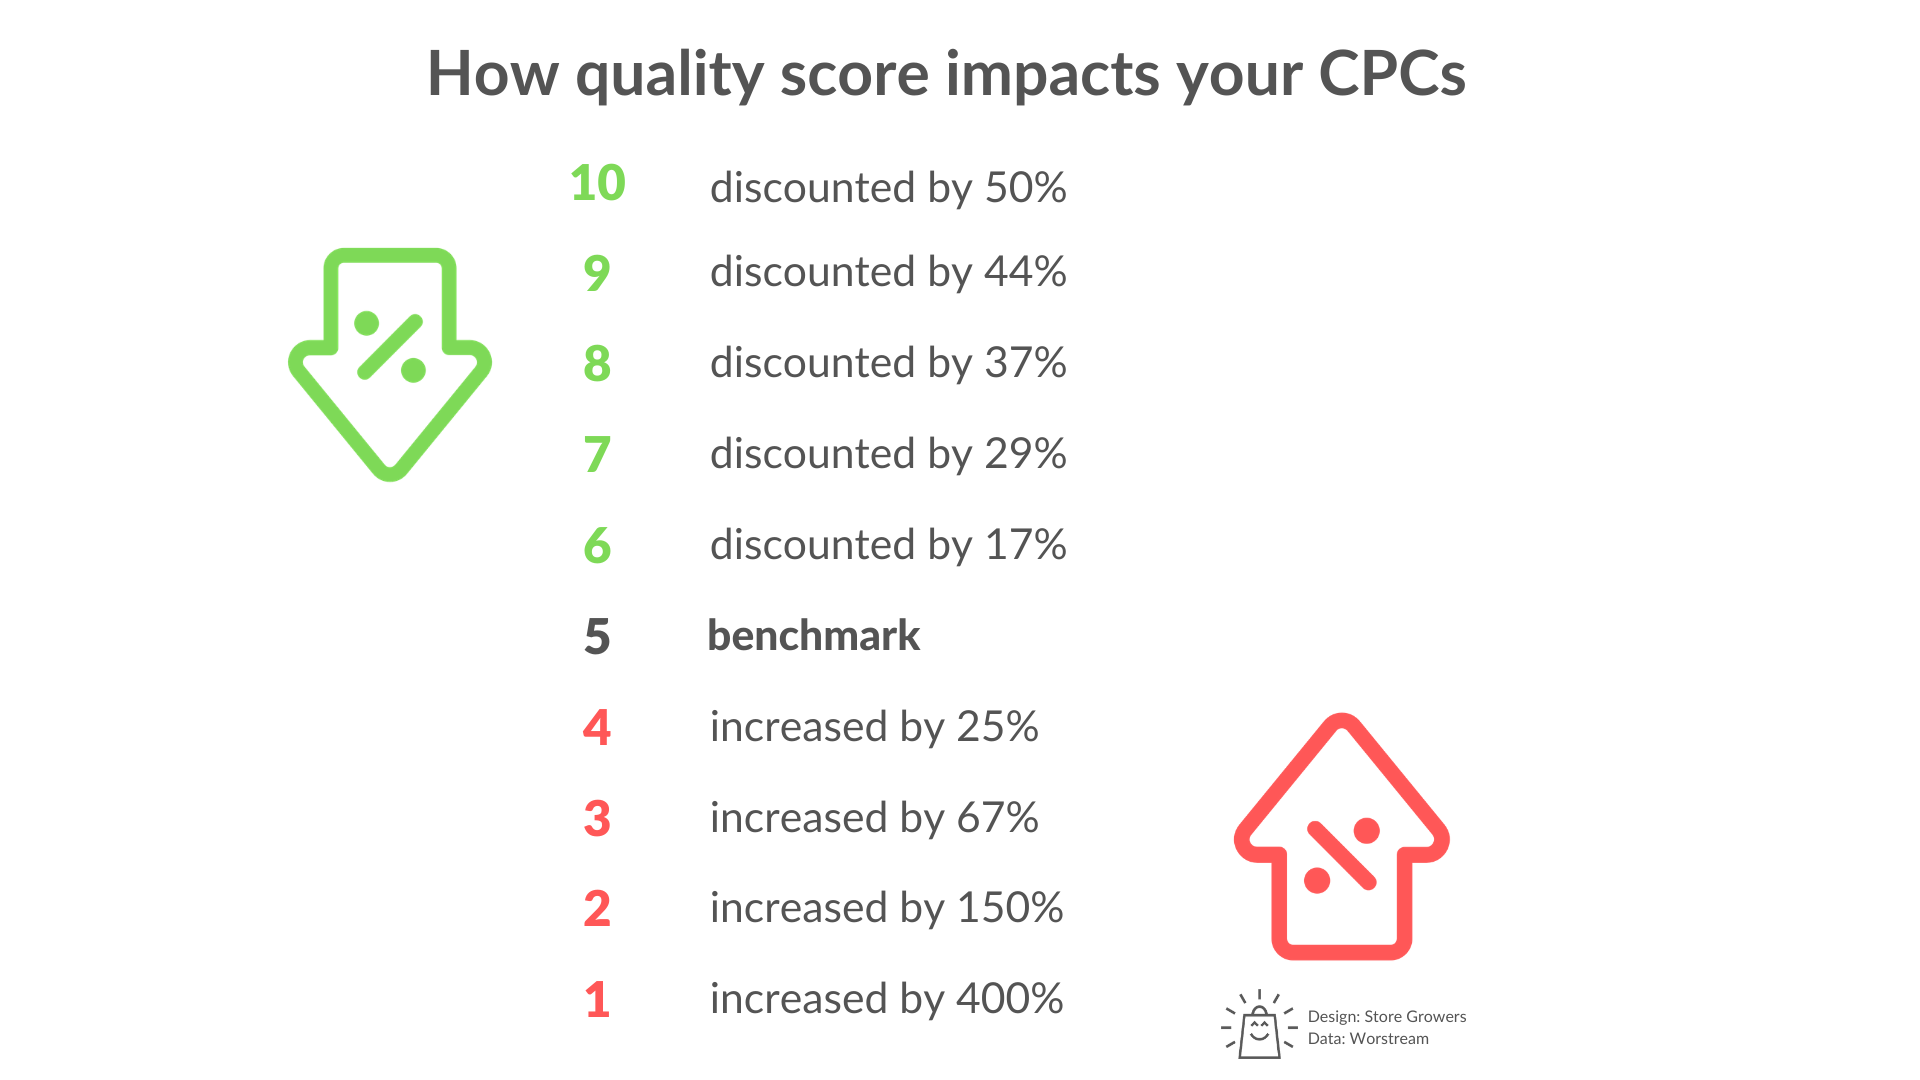
As you can see in the image above, the current average quality score is 5.
If you’re note sure what impact a lower CPC can have, let’s zoom out and look at the bigger picture:
- If your quality score is higher, you pay less for each click
- If you pay less for your clicks, your conversions will be cheaper
- If you can get more conversions for the same cost, your Return on Advertising Spend (ROAS) will increase
- This allows you to be more profitable, or increase sales volume!
The Problem With Very Low Quality Scores 😱
If your keyword has a score of 1/10 or 2/10, you’ll see the following warning in the keyword status column: “Rarely shown (low Quality Score)“.

In this case, Google may decide not to show your ads.
But even if your ads get shown, you’ll be wasting your money as the cost per click is increased by at least 150% compared to advertisers with a quality score of 5/10!
Ad Rank: Why Quality Score Matters
As I mentioned before how quality score helps to keep the ads in the search results relevant.
But what the score also allows for it to rank different advertisers depending on how relevant they are.
Here it’s helpful to understand a little more about how the ad auction works inside of Google Ads.
Here is what the ad auction looks like:
- Someone searches on Google
- Google looks at which advertisers want to show ads
- Google calculates the Ad Rank for the keyword that matches the user’s search query
- Google uses this ad rank to decide which ads will show, which position they get assigned and how each advertiser needs to pay
- This Ad Rank score determines the placement of your ads amongst the search results.
From this list, the term Ad Rank might be new to you.
Here is how Google calculates Ad Rank:
Ad Rank = Max. CPC * Quality Score (* Expected impact of ad assets)
While Max CPC is important, quality score is the most important component. Because if your score is too low, Google may simply not show your ads.
Google also predicts whether your ad assets (extensions) would give you a boost in CTR that indirectly improves your Quality Score and directly influences Ad Rank (more on this later).
It’s clear that the Quality Score plays a central role in this. So let’s take a look at it in more detail.
What Are the Key Components of the Quality Score?
Contrary to ad rank, Google’s formula for calculating Quality Score isn’t public. They’ve only shared basic details about it (probably to prevent advertisers from manipulating it 😎).
But over the years, there have been many experiments that have helped to pin down its key components.
In this section, we’ll explore all essential elements that contribute to the Quality Score to give you a deeper insight.
How to Calculate Your Quality Score?
There are three main components that make up quality score:
- Expected CTR
- Landing page experience
- Ad relevance
But they’re not all equally important. Software tool AdAlysis did a research to figure out the exact breakdown of each component.
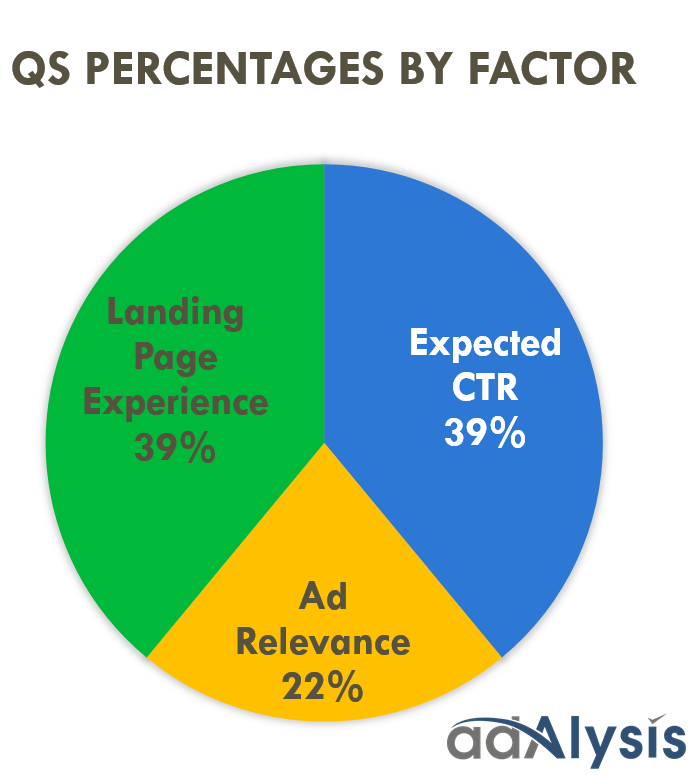
In the same research, Adalysis figured out how much each component adds to the overall score:
Now let’s take a closer look at each component.
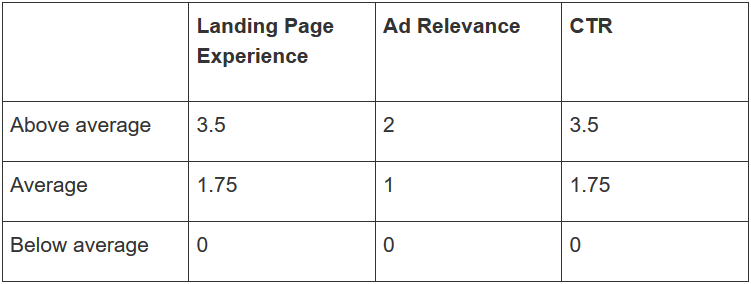
The Quality Score Formula
The same research that discovered the different weights from the pie chart above also took a crack at the Quality Score formula:
Quality Score = 1 + landing page experience weight + ad relevance weight + expected CTR weight
Example 1:
Let me illustrate this with an example. Let’s say you have the following metrics for a keyword:
- Landing page experience: Above average (3.5)
- Expected CTR: Above average (3.5)
- Ad relevance: Below average (0)
Based on the formula, you get a Quality Score of 8:
1+ 3.5 (landing page) + 3.5 (expected CTR) + 0 (ad relevance) = 8
A decent score, despite getting a zero for ad relevance.
So if the CPC for your keyword is $1 if you had a Quality Score of 5, your current score would mean a 37% discount and a resulting CPC of $0.625.
Example 2:
Now, let’s check what would happen if you score the maximum for ad relevance (2) with your other metrics being average (1.75):
1+ 1.75 (landing page) + 1.75 (expected CTR) + 2 (ad relevance) = 6.5
While there are no major issues with your CTR and landing page experience, your Quality Score is lower by 1.5 due to the increased weight of both metrics.
However, it’s not a big issue as Google rounds this value to 7 (as it doesn’t show fractions), which is still considered decent.
While ad relevance is an important factor, it seems you’d gain a greater boost to your Quality Score by focusing on your landing page and expected CTR improvements.
Component #1 – Expected CTR
Expected CTR measures how likely searchers are to click your ad.
According to Google, Expected CTR’s value is irrespective of the position of your ads, ad assets (extensions), and other factors that may affect the visibility and rank of your ad.
It is important to note that CTRs can vary significantly in Google Ads.
For one keyword, a CTR of 2% might get an “above average” Expected CTR, while another keyword with a 6% CTR might get a “Below average” score for Expected CTR
Component #2 – Ad Relevance
Ad relevance measures how relevant your ad copy is for a specific keyword.
Basically, Google measures how tightly your ads match the user intent for the search terms triggered by your keywords. The more relevant your keywords are to your ads, the better you score.
Let me illustrate this Quality Score component with two examples:
Joe sells T-shirts with animal graphics and decides to run a Google Ads campaign to advertise his products. Joe thinks the best way to increase the visibility of his ads is to stuff his ad groups with hundreds of keywords, not caring how relevant they are to his ads. Joe’s keyword of “lion” is completely irrelevant to his T-shirt ads, resulting in a below-average score.
On the other hand, James sells the same T-shirts as Joe but creates tightly themed ad groups with only a few keywords inside to match user intent with his ads. Due to James’ efforts, he gets an above-average ad relevancy score for the keyword “lion t shirt,” which increases his Quality Score by two.
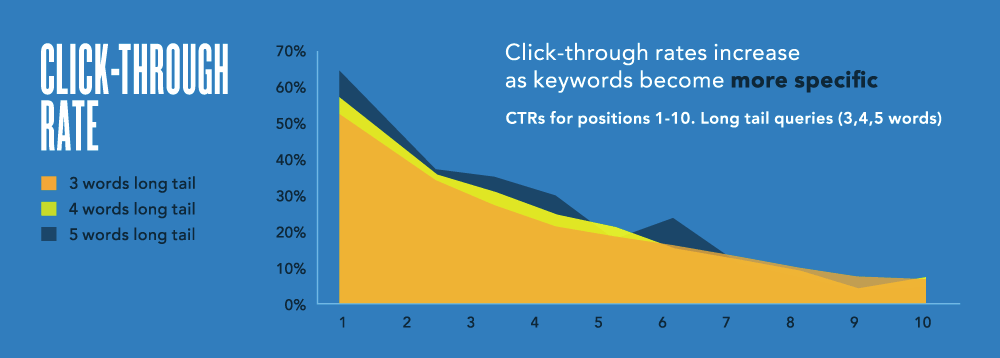
Short vs. Long-Tail Keywords
Short tail, generic keywords like “smartphone” have very high traffic, but they are also expensive with low conversion rates.
Because these searches a low on specifics, most people that search for these terms aren’t looking for the exact product that you sell.
Specific or long-tail keywords (consisting of multiple words) reflect search intent. While they have lower overall volume, these keywords are more likely to convert.
The image below shows that the more specific your keyword is, the better your CTR, positively influencing your Quality Score.
Component #3 – Landing Page Experience
The third Quality Score component, landing page experience measures how well your landing page resonates with the users’ intent after they click on your ad.
To determine your landing page score, Google uses a combination of automated systems and human evaluation.
The best way to improve your landing page experience score is to pick the most relevant page on your site for a particular ad group.
If you want to show ads for the keyword “gold necklaces” you want to send people to the category page with gold necklaces, not to your homepage which features all kinds of jewelry.
If your page doesn’t reflect what users were expecting, they will leave your site and go back to the search results. You’ll see this reflected in your bounce rate (or engagement rate) which you can check in Google Analytics 4.
This is called pogo-sticking and it negatively affects your landing page experience score.
If your pages are generic, creating new category pages, or even dedicated landing pages could also be an option in some cases.
Here are a few other things you can look at when trying to improve your landing page experience score, we’ll look at them later in this article.
Other Components
Besides these 3 main components, it’s very likely that there are other components that play a role in the quality score metric.
Historical Account Performance
If your ads have been performing well with great quality scores and related metrics for a long time, Google will trust you when you introduce new keywords. That means higher scores starting out.
On the contrary, if your account has a history of low quality scores, your account’s overall quality score will suffer, and you’ll get lower scores when you introduce new keywords for your ads.
Geography
Google calculates a different quality score for the different regions you are targeting.
While Google doesn’t display the geo-based quality scores in your Google Ads account, you can see the metric if you split up your campaigns for different target regions.
I ran an experiment in Google Ads to illustrate this location factor for you with the following details:
- Two campaigns
- Same keywords
- Same website and landing pages
- Same ads
- Different countries (Belgium and Netherlands)
Here are the quality scores for 3 keywords in Belgium:
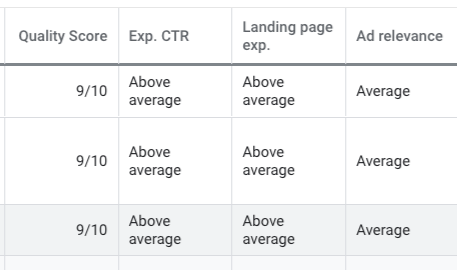
Here are the quality score for those 3 exact same keyword, but in the Netherlands:
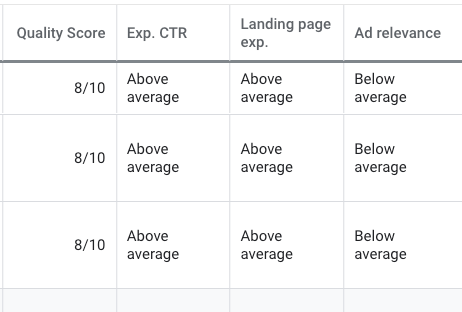
The same keyword but targeting a different, resulting in a different quality score.
This proves Google takes geographical performance into account when calculating the Quality Score.
Device Performance
Google gives different Quality Scores for specific devices based on how well your ads perform.
Your Quality Scores can also vary by the model (e.g., iPhone 11) and the operating system (e.g., Android, iOS) of the devices your searchers are using.
You can see device-specific Quality Scores if you replicate a keyword (with the same set of ads) and modify the device information (e.g., for mobile only).
How to See the Quality Score Inside Your Google Ads Account
With all this talk about quality scores, I’m sure you’re eager to discover how your keywords score. So in this section, I’ll show you how you can find it inside your Google Ads account.
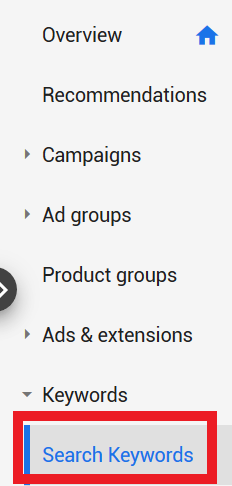
When you’re inside your account dashboard, expand the “Keywords” tab on the left and click “Search Keywords” to see all your keywords within your account.
As Quality Score is not shown by default, you’ll need to customize your columns to add the metric.
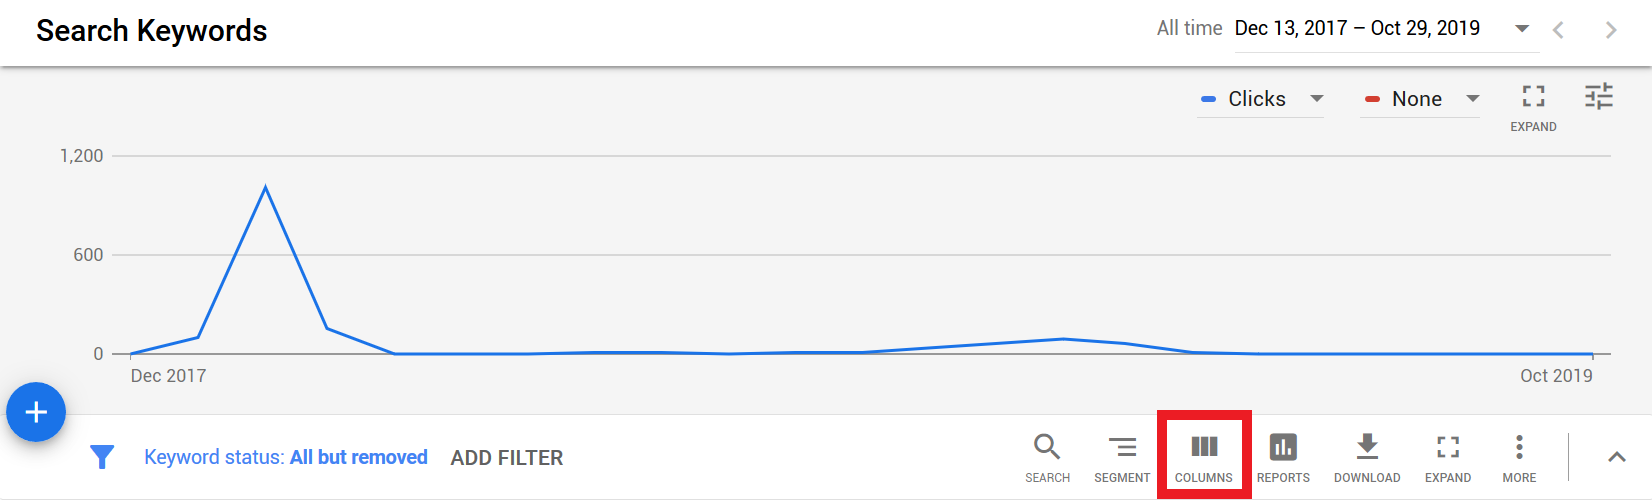
As illustrated in the image above, you first need to click the “Columns” tab.
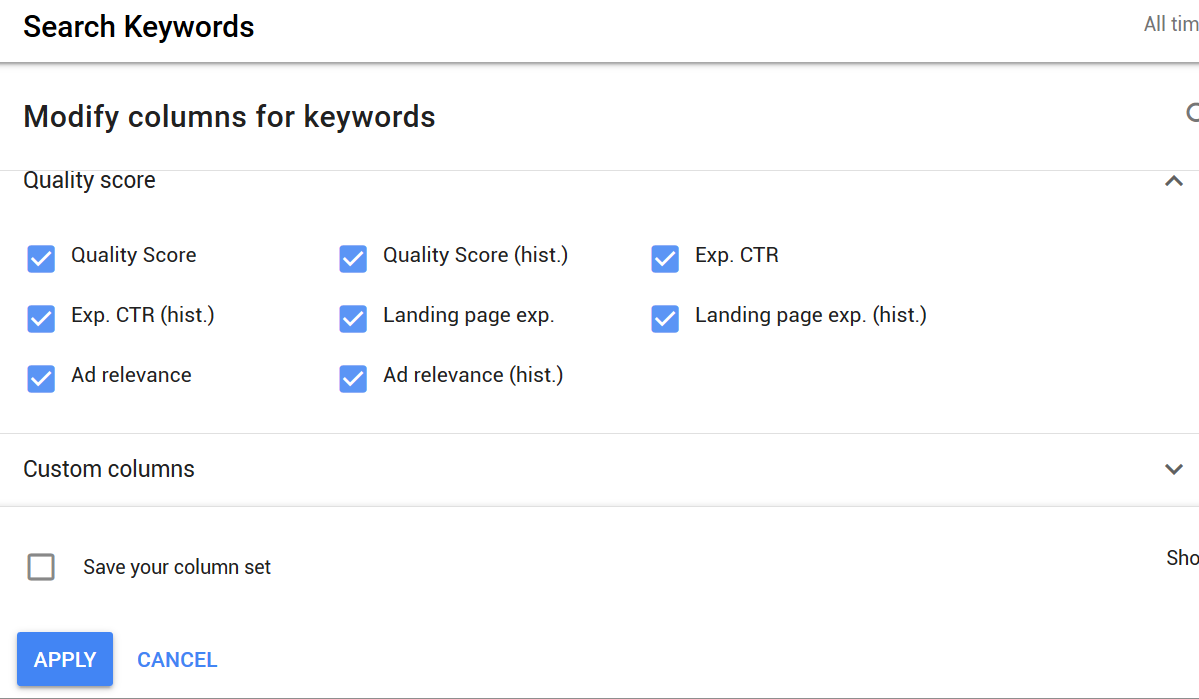
As you hover down on the next page, you’ll see a menu called “Quality Score.” After expanding it, different metrics will show with their historical counterparts:
- Quality Score
- Expected CTR
- Landing page experience
- Ad relevance
- Historical metrics
The historical metrics reflect the last known Quality Score for each of your keywords for the reporting period.
To see the scores for the end of each day, you can apply the “Day” segment to your keyword reports.
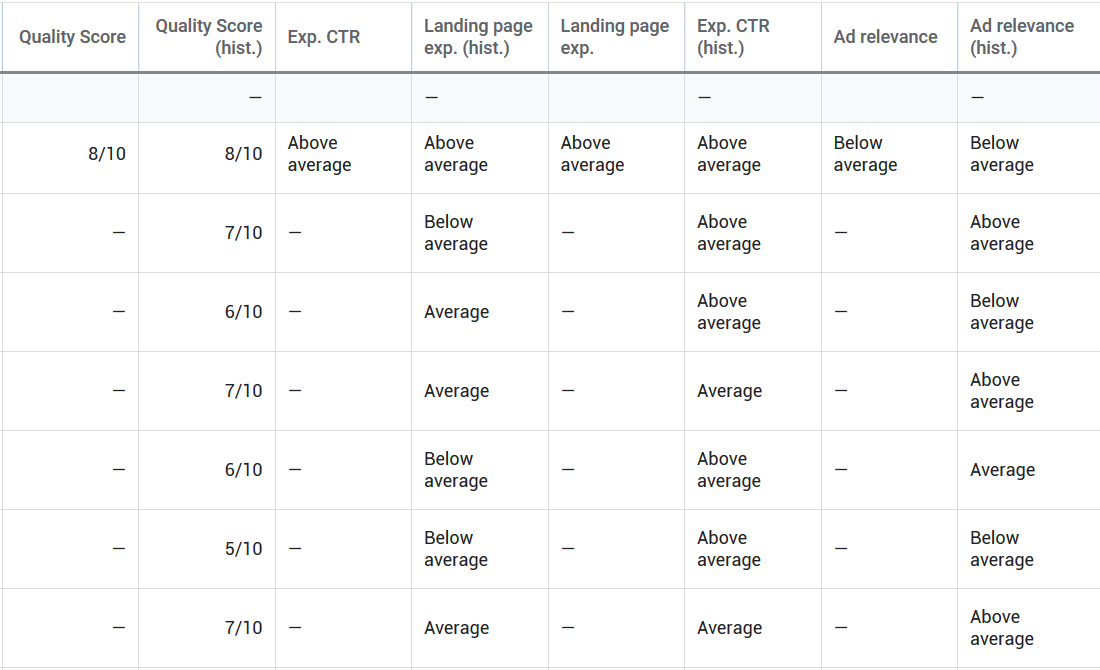
After adding the Quality Score metrics, your report’s columns should look like the image above.
If you see a “–” in your report, that means you have a null quality score.
You get this score for new keywords because Google needs to collect more performance data to evaluate them. As soon as your keyword gathers enough impressions, your Quality Score will change from null.
In the next section, I’ll show you different methods you can use to optimize your Quality Score and related metrics that influence its value.
How to Optimize Your Quality Score in Google Ads?
If you know the factors that contribute to your Quality Score, you can use that information to optimize the metric.
Since we can’t influence the quality score directly, our optimization process also works that way.
To guide you through this process, we’ve put together the following flowchart:
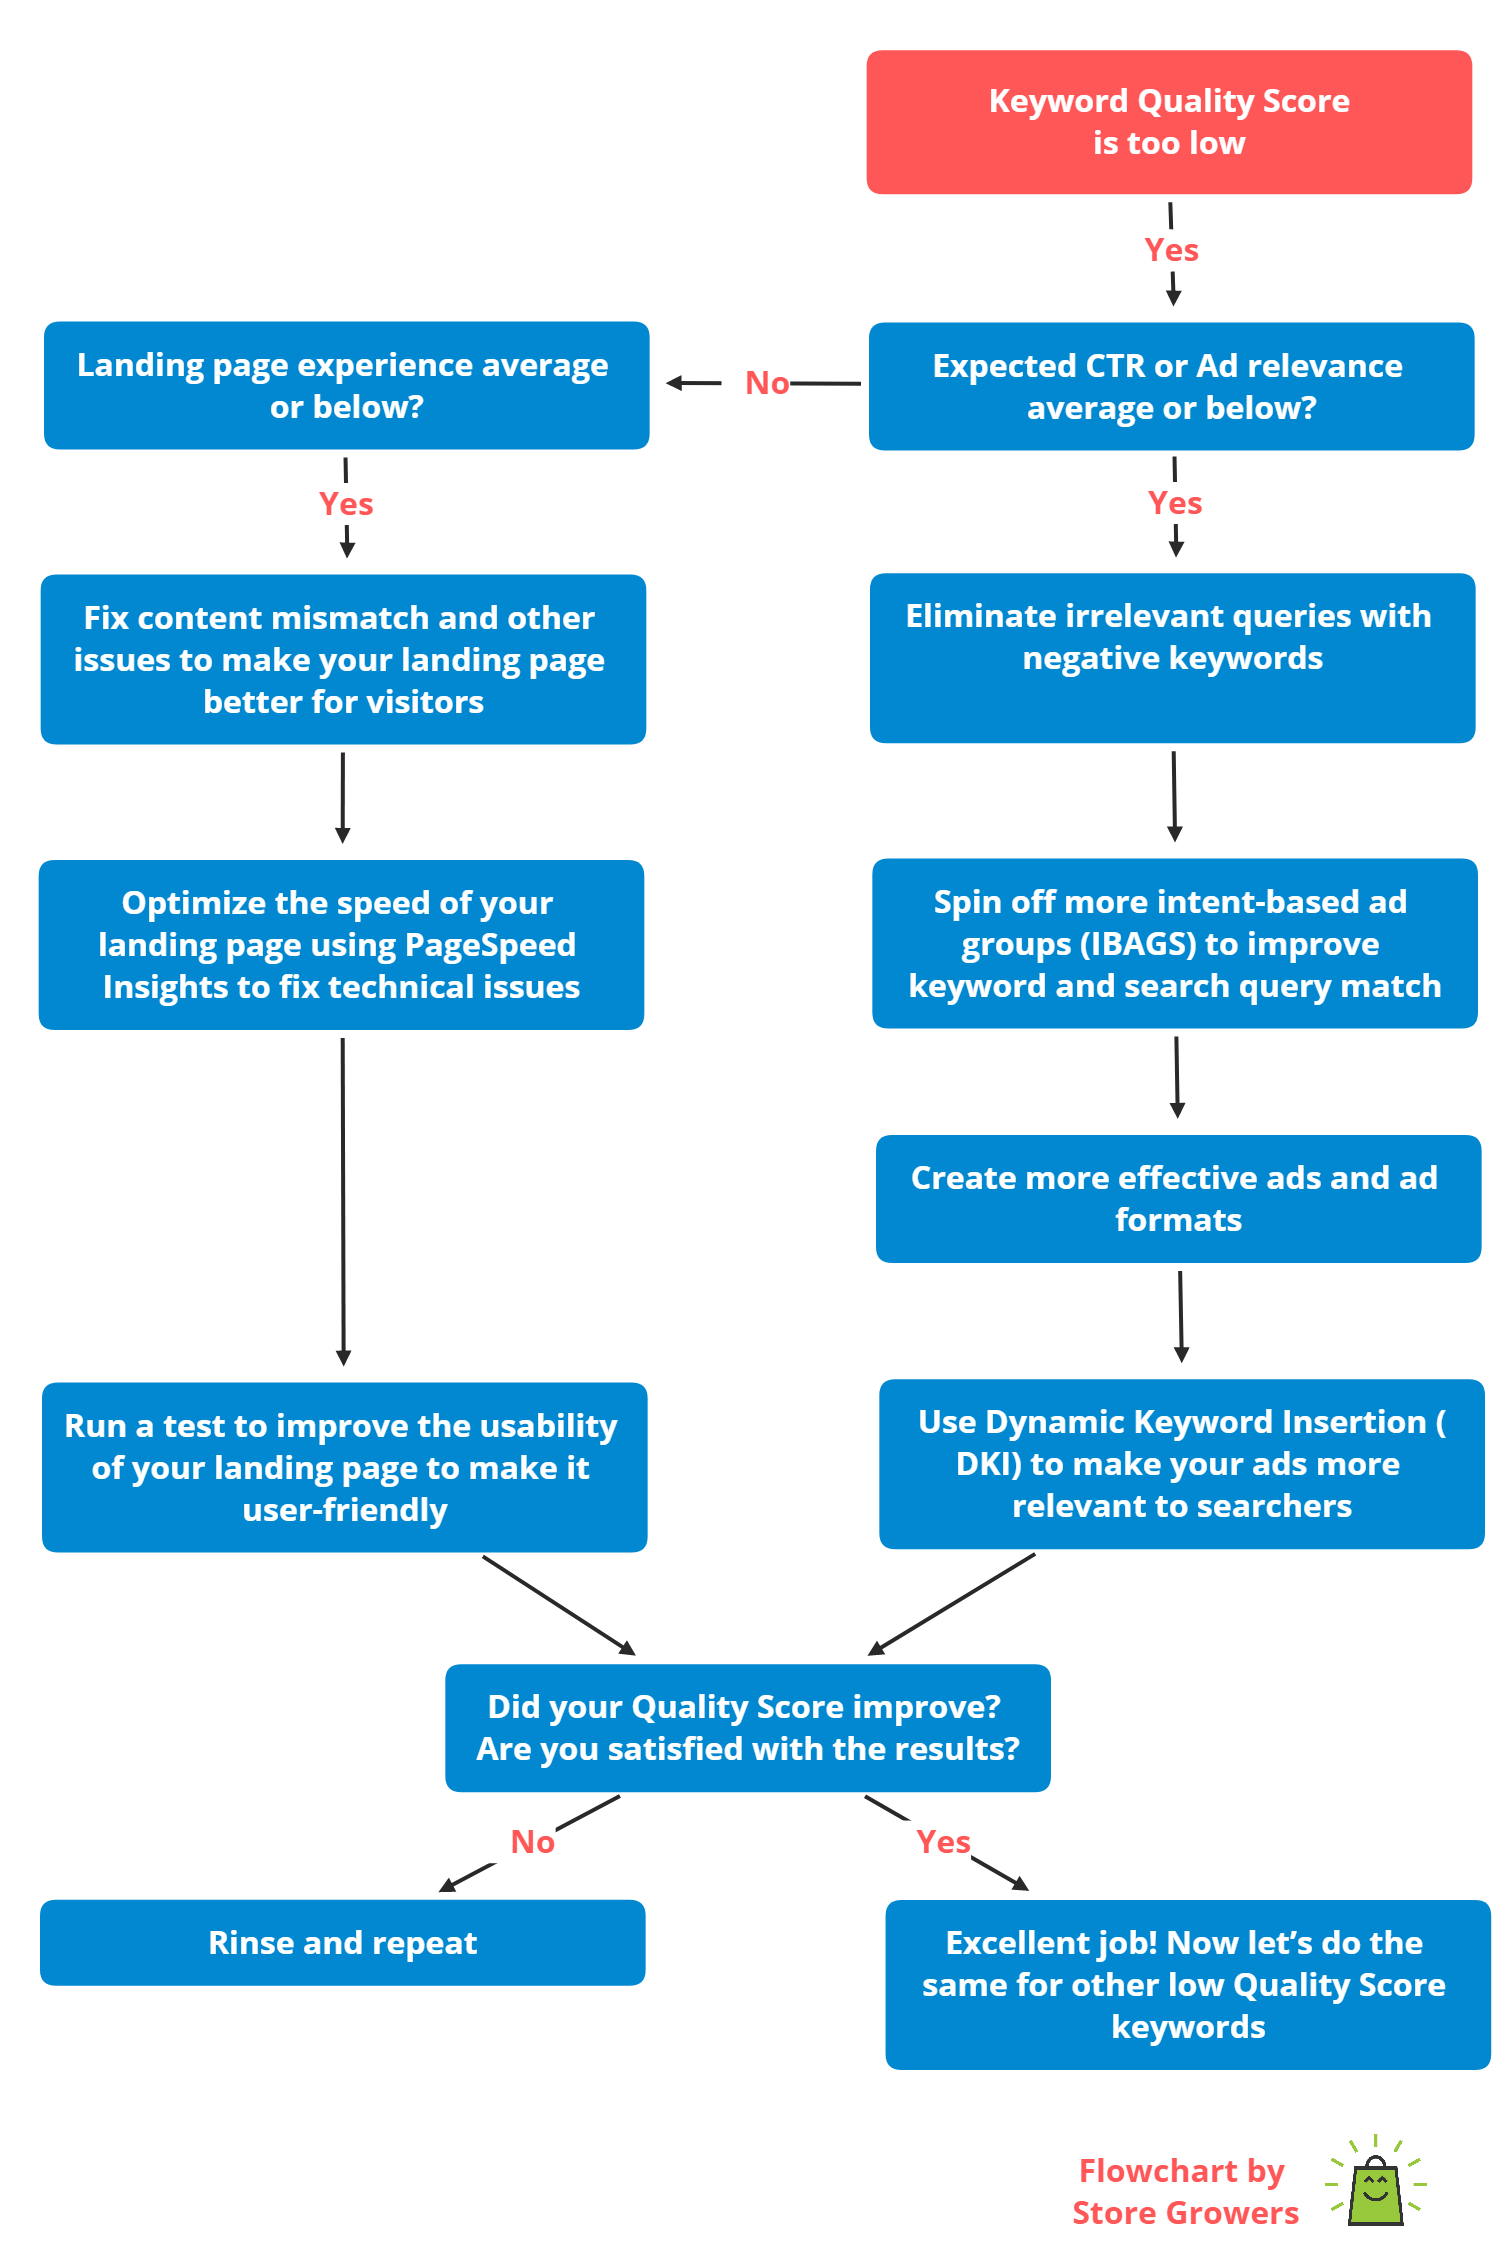
If you take a look at the image above, you can see the flowchart displays the major Quality Score-related problems with the methods you can use to solve them.
Now let’s take a more in-depth look at these optimization methods.
Review Keyword Match Types
Low CTRs are often explained by getting clicks on search queries that aren’t super related to your actual keywords.
So it might be worth it reviewing your keywords match types.
Add Negative Keywords
Negative keywords are an advertiser’s best friend, they help you get more relevant and higher quality traffic by eliminating irrelevant queries.
So while negative keywords do not directly impact the Quality Score, getting rid of irrelevant and low-converting traffic will give a boost to the overall CTR, which will indirectly improve your Quality Score.
If you want to learn more about negative keywords, I recommend checking this guide I’ve created here.
Improve Campaign Structure
A good campaign structure makes your ads much more relevant to searchers, resulting in a substantial CTR boost.
You can have the perfect copy for your ads with a great selection of relevant keywords for each, but if your campaign structure is flawed, you’ll face major issues with the performance of your ads at some point.
Optimizing campaign structure can be tedious, but it’s absolutely worth your time and energy, as this is where you’ll see the biggest improvements.
And to see those improvements, you should find a good balance between granularity and time-efficiency.
You need a high level of granularity to match the intent of your searchers, which results in a significant boost in CTRs, conversion rates, and Quality Scores. But an overly granular structure can consume (too) much of your time, making it harder to manage your campaigns.
Create More Ad Groups Via the IBAGS Approach
To make your ads super relevant to your searchers, you can either use Single Keyword Ad Groups (SKAGs) or its evolved approach called Intent-Based Ad Groups (IBAGs).
As SKAGs are not as effective as they were before Google’s updates to keyword match types, let’s focus now on IBAGs—an account structure strategy I created.
IBAGs is an evolved structure that allows advertisers to 100% match the intent of your users, resulting in excellent CTRs – leading to Quality Score boosts – as well as increased control over your bids.
IBAGs switches the focus from keywords to user intent. To match the latter, we create looser ad groups that include keywords with the same intent.
For example, keywords like “exercise bike price” and “exercise bike cost” reflect that the searcher is price-conscious.
We identify that, include both keywords in one ad group with the IBAGs approach, and focus on addressing the price consciousness of the user with our ads.
Use Dynamic Keyword Insertion
Dynamic Keyword Insertion (DKI) is a feature for Search Ads that allows you to insert the matches keyword dynamically into your ad copy.
This allows you to use generic ad copy for a wide variety of keywords, and DKI will make them more relevant.
If your ecommerce store sells a wide range of products, you’ll find this feature super useful as it’s a real timesaver when setting up the actual ads for your ad groups.
Here is an example from Google:
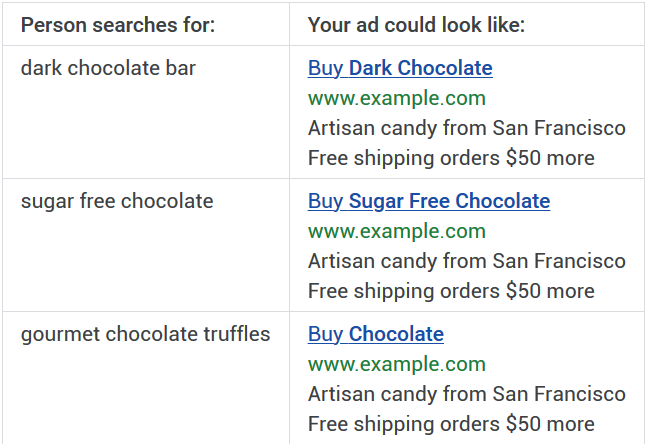
In the example above, the keyword that would normally show in the ad’s headline is “Chocolate.”
While DKI can help you get up and running quickly, it often pays to create custom ads for the specific ad groups that reflect the searcher’s intent.
Optimize Your Landing Page
Earlier in this article, I showed you how much importance Google gives to the quality of the landing page for your ad.
Two key metrics you can use to get a picture of the quality of your landing page are conversion rate and bounce rate (or engagement rate in GA4).
If you have a lot of sales, you can use your conversion rate to spot problems. But for most advertisers, it actually is a lot more actionable to look at the bounce rate.
A high bounce rate could be a result of content, usability, and technical problems of your landing page.
Improving Page Speed
With page speed, faster is always better.
But it can be quite a rabbit hole to improve the speed of your website.
So it’s important to keep in mind what Google Ads wants to see: a smooth loading experience both on mobile and desktop.
If you’re not sure if your site is any good, check your competitors to see how you stack up.
Another great tool is Google’s PageSpeed Insights. It allows you to analyze specific URLs and gives you advice on how to fix them.
Here is for example the Pagespeed score for mattress company Purple:
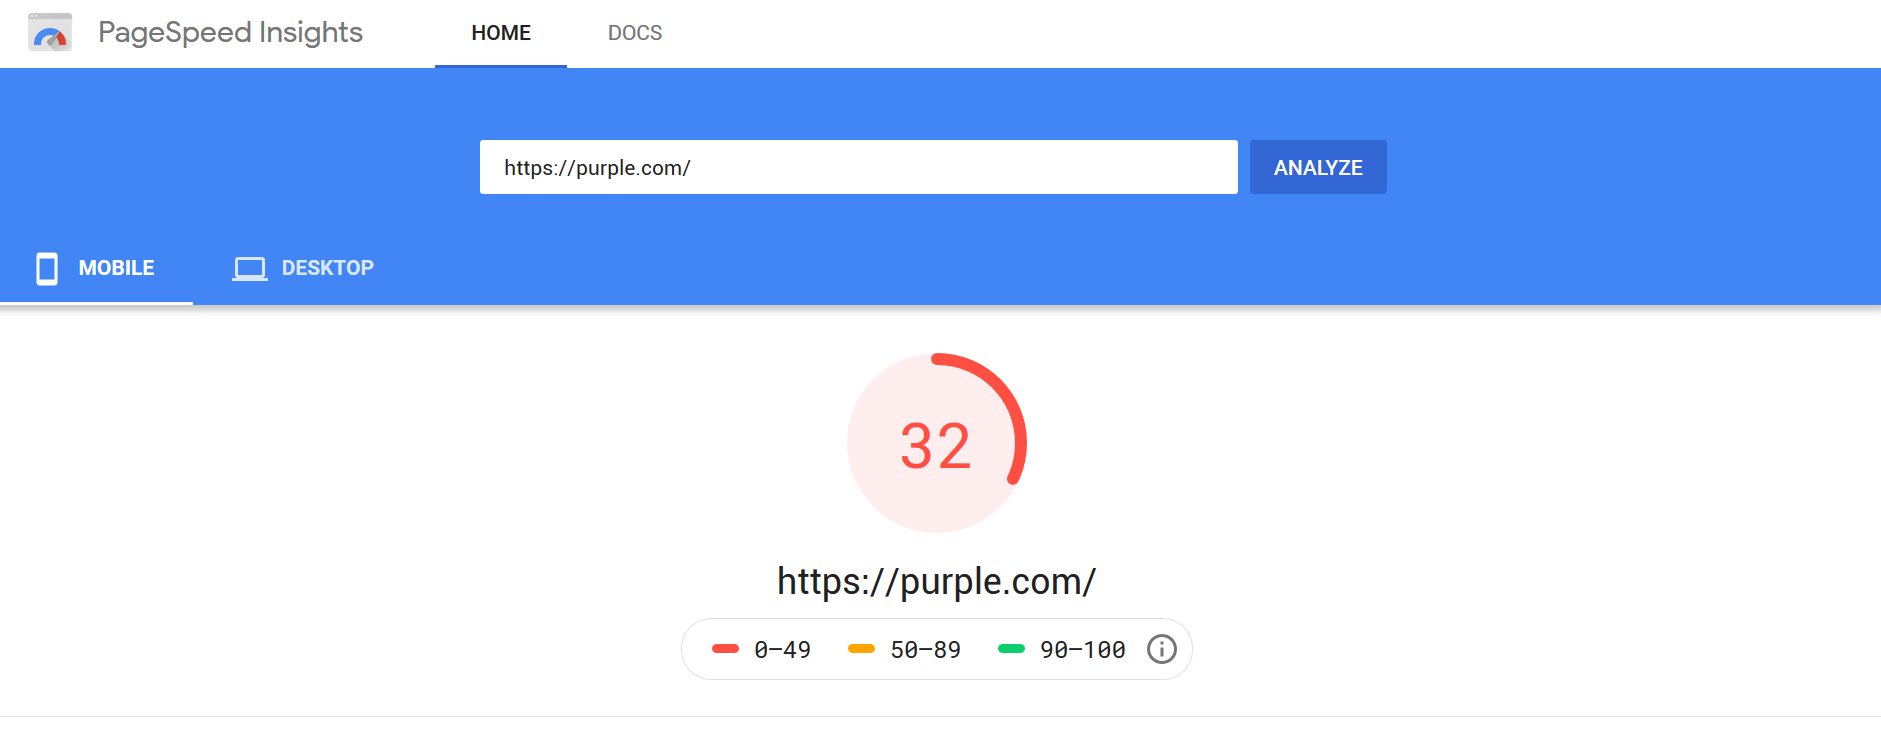
To learn more about your landing page speed score, click the little information icon under your score to the right as seen in the above image.
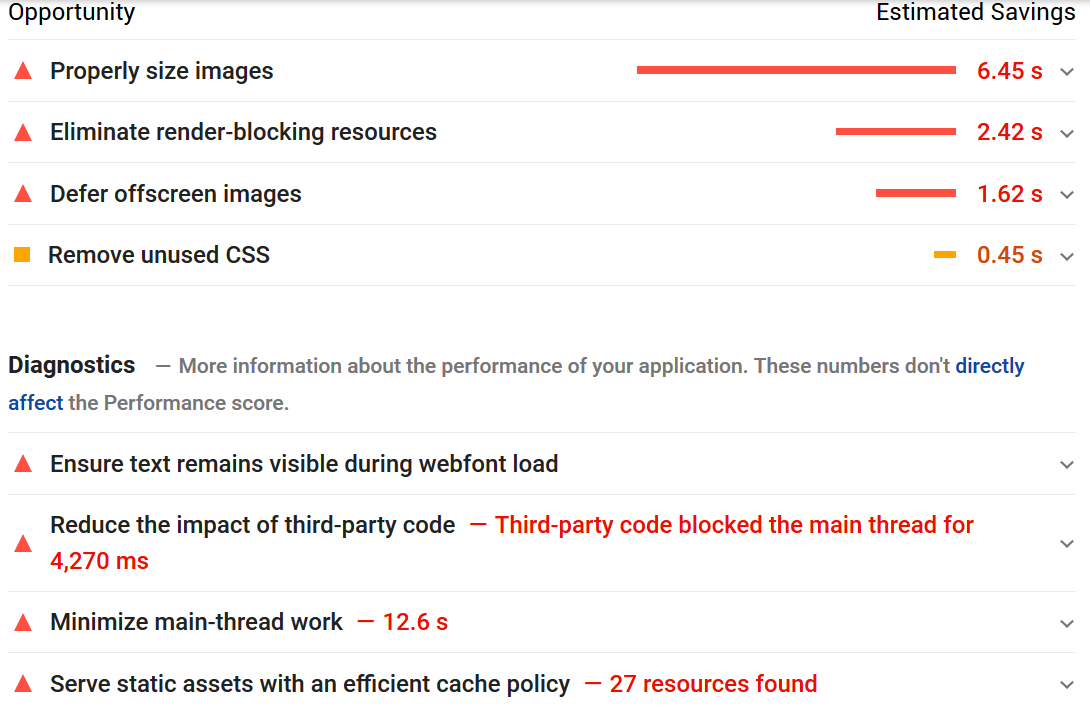
If you scroll down on the page, you’ll see tips from Google that you can use to speed up your landing page and boost your performance score.
Run a Usability Test
Now that your landing page is both fast and relevant to your ads, you need to make sure that it’s user-friendly.
By optimizing the usability of your pages, you ensure searchers will know where to go if they want to buy your products or learn more about them.
A single-person usability test is an effective and costless method to evaluate the user-friendliness of your landing pages.
I recommend prioritizing mobile devices always.
Grab your smartphone and open an incognito tab via your preferred browser app to visit your website.
You should pay special attention to your:
- Homepage – the most important page on your website
- Landing or product pages – you’ll make your sales here, and they directly affect your Quality Scores
- Category pages – users navigate here to learn more about your products
When reviewing your pages, you should ensure that:
- The most important information is visible on your page
- It is clear for users what the next step is and how to proceed with it
And don’t forget the “extras” you’ve included on your pages, such as:
- Pop-ups
- Cookie warnings
- Welcome mats
- Banners
- Customer service chat window
- Push notifications
- Buy notifications
Determine whether they add to the user experience or make it worse.
You don’t want to overwhelm your users with unnecessary extras as you risk driving them away.
Be ruthless. Eliminate everything that could annoy or distract — especially on your landing pages.
Quality Score in Performance Max, Shopping, Display, and YouTube Campaigns
While Google clearly displays the Quality Score on the keyword level in the Search Network, this metric is hidden for Shopping, Display, and YouTube campaigns.
Despite it not showing, the Quality Score is present, and Google uses it as a factor to calculating CPCs and ad rank for these campaigns as well.
As with Search Ads, Google’s business will thrive if they can perfectly match an ad with a person looking for it. So they build their system to benefit advertisers that provide this match while making other advertisers pay more for the same click.
In this section, we’ll take a look at the Quality Score for campaigns where it is hidden.
Google Shopping Quality Score
Google Shopping Ads is a great choice for ecommerce stores as this campaign type allows them to show visually appealing product ads to relevant search queries.
Instead of keywords, Google uses product attributes (e.g., product ID, product title, and product description) to pair your ads with relevant search queries. So, your Shopping Quality Score indicates how relevant your product ads are to the queries of the searchers.
As Quality Score is hidden for Shopping campaigns, we have to work with what we got. And we have a metric called Search Lost IS (rank), displaying the number of impressions you lose due to low ad rank.
When this metric is high, then either your CPC or Quality Score is too low.
So, if you improve this metric – such as by refining the search terms that trigger your Shopping ads that can increase your CTRs – your Quality Score can also get a boost.
One of the quickest ways to boost your quality score through more relevant clicks is by optimizing your product titles.
Display Network Quality Score
The Display Network allows advertisers to integrate targeted ads to millions of websites, reaching users while they read, shop, or browse.
Google calculates a separate Quality Score for not only the Search and Display Networks but for automatic (you choose the targeting, Google chooses the websites to show your ads) and managed (you choose both websites and targeting) placements.
Google takes different factors into account for different bidding options.
For CPC bidding, the calculation is very similar to the Search Network that includes both historical CTR and landing page experience as influential factors.
However, for CPM (cost-per-mile or cost-per-thousands-impressions) bidding, the Quality Score you get is mostly determined by the quality of your landing page.
YouTube Quality Score
For YouTube Ads YouTube, it’s also not clear how Google comes up with a quality score.
But if we start from the same principle: Google wants to show the best ads for a specific user in a specific situation.
On YouTube, this means showing ads that relevant to the videos users are watching at that moment, or if it is relevant to their viewing history. If the relevance is higher they more likely to be interested in the ad.
If we translate this into the different components, I think this is a good guess:
- First exposure: CTR for ads where people need to click, or View length for the ones that autoplay.
- Landing page: if the ads point to a YouTube video, View duration will be key. If the ad promotes an advertiser’s site, that CTR will be essential.
Performance Max Quality Score
I’ve kept the Performance Max quality score discussion for last. That’s because there is no such thing as a “pMax Ad”.
Instead, this ads that will show coming from this campaign are a mix of all the above: Search, Shopping, Display and YouTube.
Besides the video, Google will put an ad together from the assets that you provide, so you don’t have much control over the ad.
The main way that you can influence / improve the quality score for a Performance Max campaign, is by making sure the assets in your asset groups closely match the audience you’re targeting.
That will increase your CTR which will work wonders for your CPCs.
Track Your Quality Scores With A Google Ads Script
If you understand the importance of Quality Score, but you don’t want to be checking it daily like a maniac, this next tip is for you.
Google Ads scripts can be used for different purposes, including enhanced split testing, bid management, and reporting. Furthermore, they are highly customizable to (better) suit your needs.
This Google Ads script tracks Quality Scores makes tracking those metrics a lot easier.
After you add the script into your account, it will check the different Quality Scores every day and log it into a spreadsheet for you. That way you have a log of your previous quality scores which allows you to see possible trends over time.
Here is an example:
This article will explain to you in detail what to do.
Quality Score: Not the Holy Grail But a Way to Reveal Real Problems
There are clear benefits to optimizing your quality scores, your clicks are cheaper and you can rank higher with your ads.
But focusing blindly on your quality score while ignoring other more important metrics like ROAs or profit will hurt your efforts over the long haul.
There’s no point in having extremely low CPCs with high CTRs if your ads don’t convert. And, in ecommerce, conversions are what matter the most.
Instead of the ultimate goal, think of the quality scores as something you can use to help fix issues within your account and optimize the performance of your campaigns.